

Reanalysis comparison with observations for validation purposes#
Production date: 03-05-2024
Produced by: CNR-ISMAR
Investigating large-scale flows in the marine boundary layer over remote regions#
Quality assessment question#
Are state-of-the-art reanalysis products a good representation of near-surface temperature, wind and humidity conditions over the Pacific Northwest Ocean?
By comparing model results with relevant observations, differences between the model and observations can be identified and quantified. However, the validation of reanalysis products over remote areas is difficult due to the scarcity of reliable in situ measurements. In this case, the latest reanalysis by the European Centre for Medium-Range Weather Forecasts (ECMWF), ERA5, was validated with data collected during the 2022 and 2023 campaigns by the Aeroclipper platform [1]. The Aeroclipper is a quasi-Lagrangian balloon that provides in situ measurements of atmospheric parameters at heights of 30-40 metres above the ocean [2], representative of the bottom of the boundary layer that strongly interacts with turbulent flows (momentum, energy, water) at the ocean energy, water) at the ocean-atmosphere interface. This balloon is an interesting tool for assessing the representation of the surface layer of the atmosphere by meteorological models and reanalyses, because it can provide high-frequency and high-quality measurements - i.e. not disturbed by the mass of a ship - on quasi-Lagrangian trajectories, which can be compared with gridded data.
Quality assessment statements#
These are the key outcomes of this assessment
Differences between model and observations were found to be systematic: misture and temperature vertical gradients are found to be too large in ERA5 compared with Aeroclipper measurements; a too small wind shear near the surface is also detected in the reanalysis
Biases founded here mostly concern tropical oceanic regions and are at least partly due to data assimilation known issues
Methodology#
In order to assess the representation of the surface layer in ERA5, a comparison between Aeroclipper measurements - not assimilated in the model - and the reanalysis, is carried out for the six Aeroclipper flights performed over the northwest Pacific in 2022 and 2023. Results are based on a one-hour average for Aeroclipper measurements and for interpolated ERA5 values at the balloon position. For consistency with the height at which the measurements are taken, both the variables at 2m and those of the first three model levels of ERA5 [2] are taken into account for comparison. This means that reference must be made both to the single levels dataset, for the former, and to the complete dataset for the latter.
Results are shown for:
2. Air temperature and radiative temperature at the surface
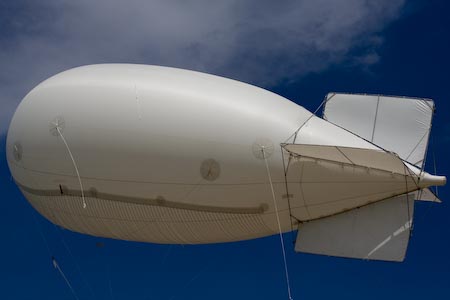
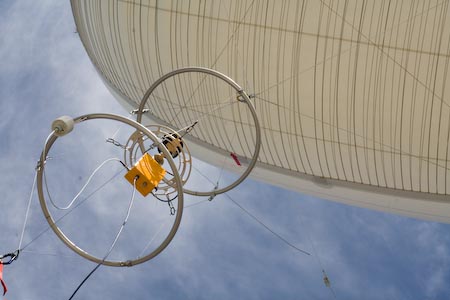
Sample of an Aeroclipper and its payload. Reproduced from https://www.lmd.ens.fr/vasco/gal.html.
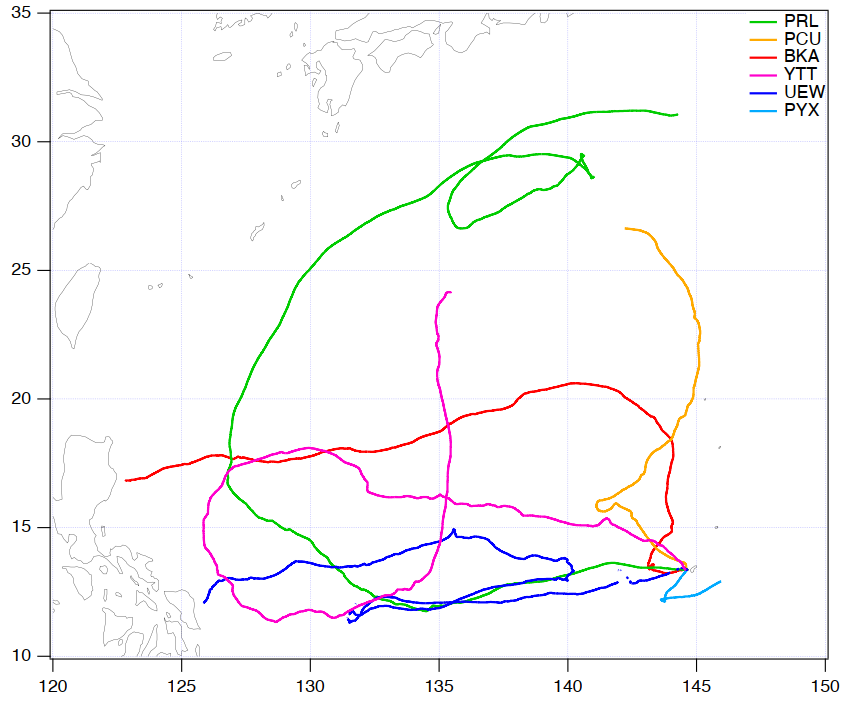
Fig. 1 Trajectories of the six Aeroclipper flights (PRL ,PCU and BKA) in 2022 and (YTT, UEW and PYX) in 2023.#
Analysis and results#
1. Specific humidity#
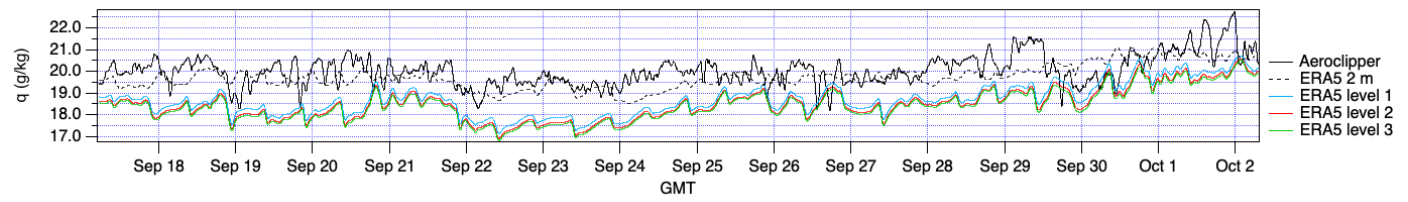
Fig. 2 Timeseries of specific humidity (q), for the YTT Aeroclipper measurement (solid black), ERA5 surface parameters (dotted black) and ERA5 for the first three model hybrid levels (solid colors). The timeseries are smoothed with a running mean with ∆t=60 minutes.#
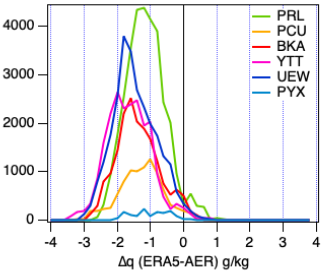
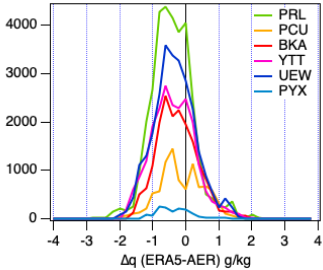
Fig. 3 Distribution of the differences between Aeroclipper measurements for the six flights and corresponding ERA-5 values at model level 2 (i.e., ~31m) (left) and at 2m (right) for the specific humidity (∆q).#
The analysis shows that the specific humidity above 10 m is underestimated by more than 1 g/kg. The underestimation of specific humidity in the first three model levels appears to be, at least in part, related to the assimilation process, which tends to dry out these model levels at the beginning of each 12-hour assimilation window [4]. Dampening then follows, but without reaching an equilibrium or a value close to those observed. At 2 m, the drying due to assimilation is less and the humidity reaches equilibrium a few hours after forecast starts, so the specific humidity at 2 m is in better agreement with the Aeroclipper measurements, but still with a negative bias. This leads to the conclusion that the vertical moisture gradients in the surface layer of the atmosphere are too large in ERA5 compared to the Aeroclipper measurements. Data obtained from field campaigns are a useful complement to global datasets to perform validation, see e.g. Johnston et al., 2021 [5].
2. Air temperature and radiative temperature at the surface#
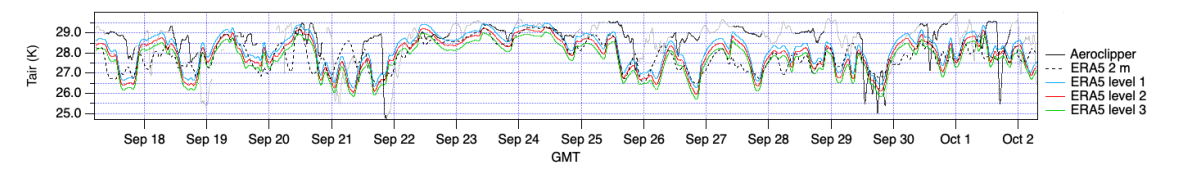
Fig. 4 Timeseries of air temperature (T), for the YTT Aeroclipper measurement (solid black, observed Tair during daylight in grey), ERA5 surface parameters (dotted black) and ERA5 for the first three model hybrid levels (solid colors). The timeseries are smoothed with a running mean with ∆t=60 minutes.#
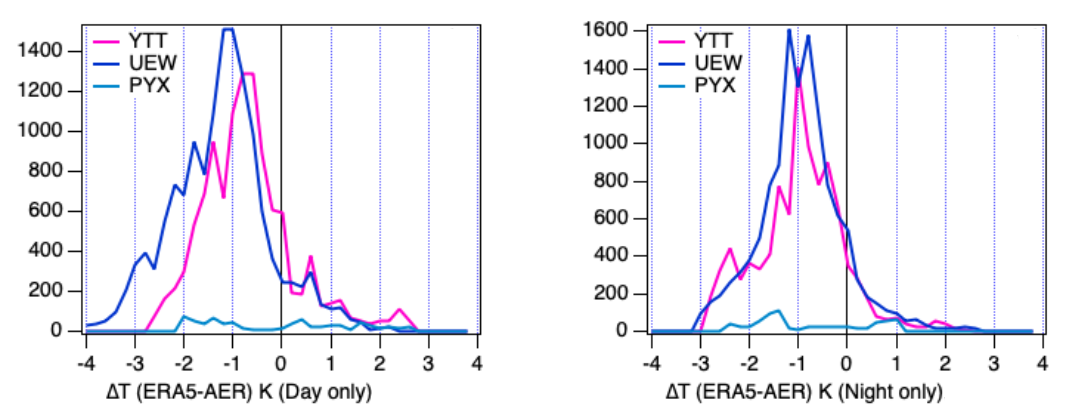
Fig. 5 Distribution of the differences between Aeroclipper measurements for the three 2023 flights and corresponding ERA-5 values at model level 2 (i.e., ~31m) for the air temperature (∆T) during daytime only (left) and nighttime only (right).#
Analysis shows that the air temperature of the first three model levels is underestimated by about 1 K in ERA5 compared to Aeroclipper measurements. In most cases, the temperature difference at 2 m is similar to the temperature at the first three model levels and is sometimes even smaller. The bias seems to be due to overcooling of the surface layer by the model, particularly at night during the forecast, and corrected in part by the assimilation process [4]. Moreover, ERA5 underestimation is only marginally impacted by the diurnal cycle.
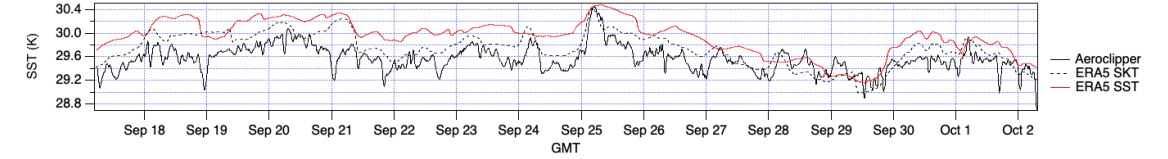
Fig. 6 Timeseries of sea surface temperature (SST), for the YTT Aeroclipper measurement (solid black), ERA5 surface parameters (dotted black) and ERA5 for the first three model hybrid levels (solid colors). The timeseries are smoothed with a running mean with ∆t=60 minutes.#
Equivalent brightness temperature values have been compared with the ERA5 skin and sea surface temperature (SKT and SST). As expected, as the YTT flight covers the end of September, the ERA5 SKT is generally smaller than the ERA5 SST, with the exception of low wind speed conditions where a diurnal warm layer develops. At the same time, SKT is slightly larger than the radiative temperature measurement of the Aeroclipper. It should be noted that since there is no measurement of downward IR radiation at the surface, no correction has been applied to the Aeroclipper radiative temperature, partly explaining the ERA5 overestimation. The lower skin radiative temperature measured by the Aeroclipper may also be due in part to the absence of correction for radiative transfer between the surface and the radiometer, whereby the approximately 35 m of rather damp layer may affect the IR transmission in the water vapour continuum. Nevertheless, this result is in substantial agreement with the one in He et al., 2023 [6], in which in-situ and satellite data are used to validate ERA5 near-surface air temperature over global oceans (see i.e. Fig 11). In conclusion, assuming that the SKT is well represented in ERA5, this study shows that vertical gradients of temperature in the atmospheric surface layer are too large in ERA5 compared with Aeroclipper measurements.
3. Wind speed#
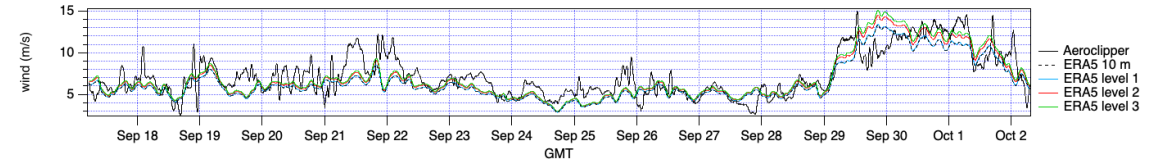
Fig. 7 Timeseries of wind speed (V) for the YTT Aeroclipper measurement (solid black), ERA5 surface parameters (dotted black) and ERA5 for the first three model hybrid levels (solid colors). The timeseries are smoothed with a running mean with ∆t=60 minutes.#
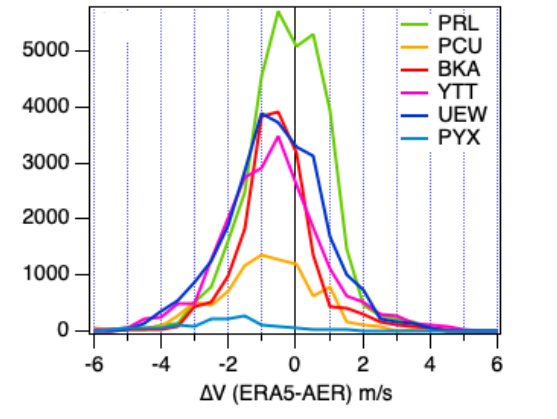
Fig. 8 Distribution of the differences between Aeroclipper measurements for the six flights and corresponding ERA-5 values at model level 2 (i.e., ~31m) for the wind speed (∆V). The timeseries are smoothed with a running mean with ∆t=60 minutes.#
The analysis shows that the wind speed is underestimated by about 0.5 ms-1 in ERA5 compared to Aeroclipper measurements. The wind underestimation is greater during convective episodes associated with convective cold pools and large wind gusts (see e.g. around 22 September). The underestimation of wind speed therefore seems to be partly related to the lack of cold pools in the model. In addition, there is a slight decrease in wind due to assimilation, which is compensated for during the forecast. It can therefore be stated that there is too little wind shear near the surface in ERA5. This result is in substantial agreement with that of Campos et al. [7], where in-situ and satellite data are used to validate the wind speed of ERA5 over the Atlantic Ocean (see e.g. Fig. 4).
If you want to know more#
To find out the differences with respect to near-surface variables over the tropical Pacific between the state-of-the-art ERA5 and the previous ERA Interim version, see for example F Li et al., 2021 [8].
Key resources#
Some key resources and further readings were linked throughout this assessment. The CDS catalogue entries for the data used were:
ERA5 monthly averaged data on single levels from 1940 to present: https://cds.climate.copernicus.eu/cdsapp#!/dataset/reanalysis-era5-single-levels-monthly-means?tab=overview
Complete ERA5 global atmospheric reanalysis: https://cds.climate.copernicus.eu/cdsapp#!/dataset/reanalysis-era5-complete?tab=overview
References#
[1] Paul Poli, personal communication, 2024
[2] Duvel, Jean Philippe & Basdevant, Claude & Bellenger, Hugo & Reverfdin, Gilles & Vialard, Jerome & Vargas, a. (2009). The Aeroclipper: A New Device to Explore Convective Systems and Cyclones. Bulletin of the American Meteorological Society. 90. 63-71. 10.1175/2008BAMS2500.1.
[3] ECMWF Confluence page
[4] Dee, D.P. (2005), Bias and data assimilation. Q.J.R. Meteorol. Soc., 131: 3323-3343. https://doi.org/10.1256/qj.05.137.
[5] Johnston, Benjamin R., William J. Randel, and Jeremiah P. Sjoberg. 2021. “Evaluation of Tropospheric Moisture Characteristics Among COSMIC-2, ERA5 and MERRA-2 in the Tropics and Subtropics” Remote Sensing 13, no. 5: 880.
[6] M. He, J. Qin, N. Lu and L. Yao, “Assessment of ERA5 Near-Surface Air Temperatures Over Global Oceans by Combining MODIS Sea Surface Temperature Products and In-Situ Observations,” in IEEE Journal of Selected Topics in Applied Earth Observations and Remote Sensing, vol. 16, pp. 8442-8455, 2023, doi: 10.1109/JSTARS.2023.3312810.
[7] Campos RM, Gramcianinov CB, de Camargo R, da Silva Dias PL. Assessment and Calibration of ERA5 Severe Winds in the Atlantic Ocean Using Satellite Data. Remote Sensing. 2022; 14(19):4918. https://doi.org/10.3390/rs14194918.
[8] Jui-Lin F Li et al 2021, Improved ice content, radiation, precipitation and low-level circulation over the tropical pacific from ECMWF ERA-interim to ERA5, Environ. Res. Commun. 3 081006.