

Methane satellite observations uncertainty and completeness assessment for carbon cycle#
Production date: 02-09-2024
Produced by: Consiglio Nazionale delle Ricerche (CNR)
🌍 Use case: Monitoring the carbon cycle in tropical regions#
❓ Quality assessment questions#
Is the uncertainty of satellite-based observations sufficiently low to assess year-to-year anomalies in methane emissions of wetlands?
Is the spatial and temporal resolution/coverage of satellite-based observations sufficient to assess year-to-year anomalies in methane emissions of wetlands?
Methane (CH4) is the second most important anthropogenic greenhouse gas, representing about 19% of the total radiative forcing by long living greenhouse gases [1]. Natural wetlands account for up to 30% of global methane (CH4) emissions, but a large uncertainty (up to 65%) still affects tropical wetland CH4 emission estimates [2]. The positive response of wetland CH4 emissions to climate change is an important feedback that can amplify atmospheric CH4 values. This response can be related to the effect of rising temperatures on microbial activities (e.g., methanogenesis) and to the expansion of wetlands with increased total precipitations. Intensified wetland CH4 emissions have been reported during 2000–2021 ([3]), highlighting the need for sustained monitoring and observations of global wetland CH4 fluxes. Moroever, future projections of wetland CH4 emissions suggested sustained emission increase under different climate change scenarios ([3] and [4]). Satellite observations can represent a powerful tool for contributing to enhance the knowledge about CH4 sources and sinks. While these data are commonly used in inverse modelling system (e.g., [5]), this assessment explores the possibility to directly use satellite CH4 data for investigate year-to-year anomalies in CH4 emissions of tropical wetlands.
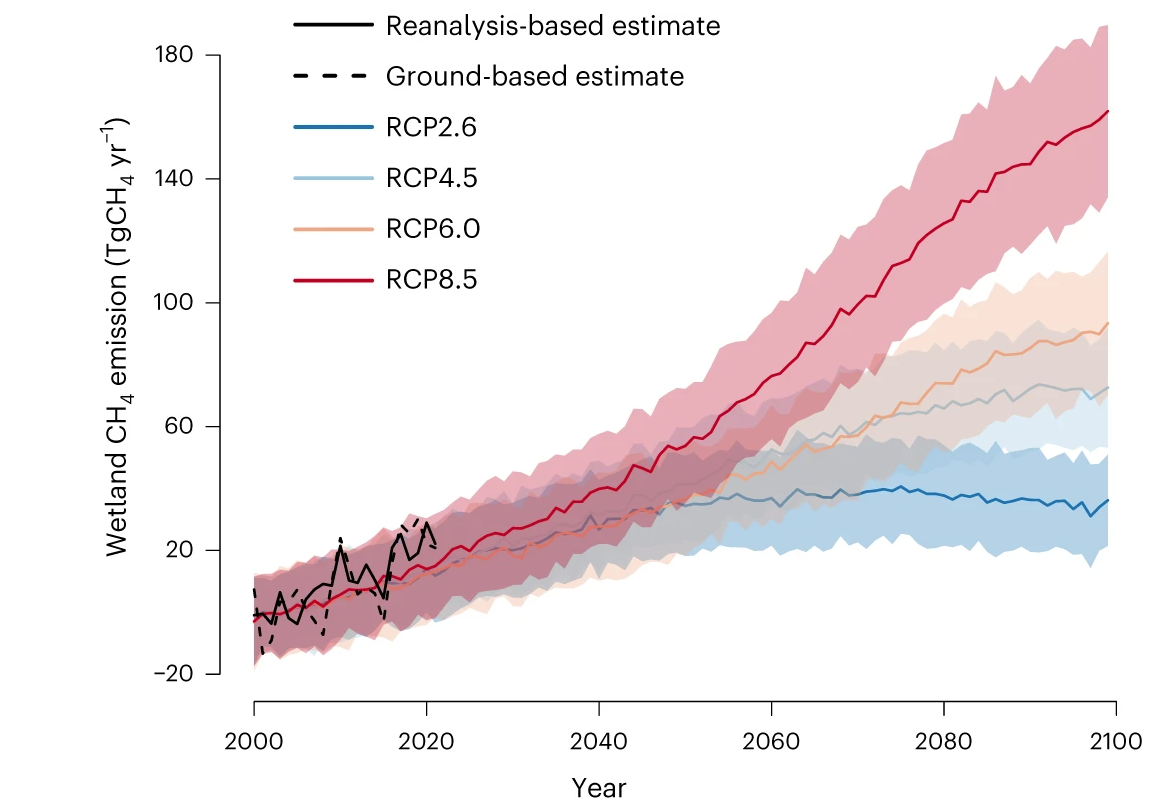
Fig. 1 The figure shows temporal trends and variations in wetland CH4 emissions during 2000–2021 relative to the baseline of 2000–2006 level in comparison to future projections. Black lines report variations over 2000-2021 as derived from simulations based on two climate forcing datasets: a ground-based dataset from the CRU at the University of East Anglia (continuous line) and a reanalysis-based MERRA2 (dashed line). Coloured lines represent the ensemble mean of each future projection RCP scenario, while shaded areas represent the 1σ range of the future estimates. The estimated increase in emissions over 2000-2021 appears to be higher than under any of the RCP scenarios. Image reproduced from [3] under CC-BY license.#
📢 Quality assessment statement#
These are the key outcomes of this assessment
In terms of uncertainty, Level 2 XCH4 data products appear appropriate for investigating inter-annual XCH4 variability associated with anomalies in tropical wetland emissions
In terms of spatial/temporal resolution, Level 2 XCH4 data products appear appropriate for investigating inter-annual XCH4 variability associated with anomalies in tropical wetland emissions
In terms of spatial/temporal coverage, users would use data products derived by algorithms (such as CH4_GOS_OCPR, CH4_GO2_SRPR or XCH4_EMMA) that optimise data availability over regions frequently affected by cloud cover or high aerosol loading.
Users should consult the documentation as well as the uncertainty and quality flags in the data files as appropriate for their applications. It should also be emphasised that the use of the XCH4 data provided by satellite is not trivial, and interpretation of these products typically requires appropriate modelling [6].
Users will need to consult product user guides ([6]) for guidance on how to use the averaging kernels when using satellite CH4 data, especially for comparison with model outputs
📋 Methodology#
To assess if the uncertainty, spatial/temporal resolution and coverage of satellite-based observations are sufficient to investigate year-to-year anomalies in CH4 emissions of tropical wetlands, we inspected the documentation of the CDS dataset “Methane data from 2002 to present derived from satellite observations” ([7], [6], [8]) as well as a case study available from scientific literature ([9]). Please note that to analyse annual anomalies in wetland methane emissions, [9] used an earlier version (v7) of Level 2 data from the CH4_GOS_OCPR data product.
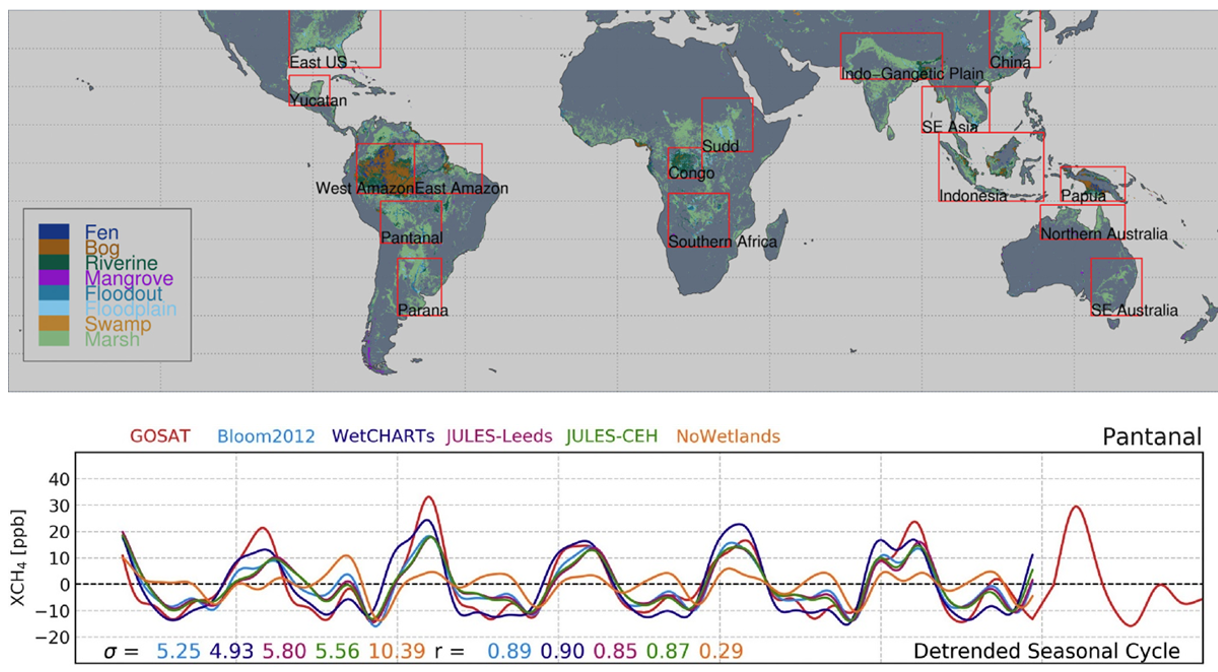
Fig. 2 Map showing the location of the individual wetland regions identified using the Sustainable Wetlands Adaptation and Mitigation Program (SWAMP) data from the Center for International Forestry Research (CIFOR) and timeseries of detrended XCH4 seasonal cycle over the Pantanal region, including the CH4_GOS_OCFP dataset (“GOSAT”) and model simulations utilising the different wetland emission. Image reproduced from [9] under CC-BY license.#
The analysis and results are organised in the following steps, which are detailed in the sections below:
We inspected the uncertainty related to the data product used by [9] and we compared with that reported by the product quality assessment report related to “Methane data from 2002 to present derived from satellite observations” ([8]).
2. Spatial resolution assessment
We inspected the spatial and temporal resolution of the data product used by [9] and we compared with that reported by the Level 2 of the dataset “Methane data from 2002 to present derived from satellite observations” ([6]).
3. Spatial and temporal coverage
[9] used a ‘proxy (PR)’ data product (CH4_GOS_OCPR) to take advantage of the higher data availability compared to the ‘full physics (FP)’ product (CH4_GOS_OCFP) in regions such as the tropics, which are characterised by the prevalence of clouds and high aerosol loading. PR products typically contain more data points and better coverage compared to FP: PR products suffer less from potential biases and therefore require less strict quality filtering resulting in more data points with quality flag “good” in the final product files ([6]).
📈 Analysis and results#
1. Uncertainty assessment#
The data product used by [9] was characterised by a random error of 13 ppb and a relative spatial bias of 2 ppb with respect to TCCON co-located observations ([10]). According with [8], the Level 2 XCH4 products of the dataset “Methane data from 2002 to present derived from satellite observations” have uncertainties comparable to those of the dataset used by [9]: individual measurement accuracies are typically less than 20 ppb (13 ppb for the latest version of CH4_GOS_OCPR), while the relative spatial bias is less than 6.2 ppb (4 ppb for CH4_GOS_OCPR). Moreover, except for the SCIAMACHY XCH4 products, the single measurements random errors are close to the “breakthrough” requirement (< 17 ppb) defined by the Climate Research Group (CRG) of the ESA GHG-CCI project for the usability of satellite measurements to derive information on regional scale sources and sink of methane [11].
Thus, the Level 2 XCH4 products of the dataset “Methane data from 2002 to present derived from satellite observations” have uncertainties sufficently low to assess year-to-year anomalies in XCH4 related to wetland emissions in tropical regions.
2. Spatial resolution assessment#
The Level 2 XCH4 products of the dataset “Methane data from 2002 to present derived from satellite observations” are an updated version of the dataset used by [9] and they have a spatial resolution characterised by the native satellite footprint (i.e., with a 10 km diameter and single observations typically on the order of 100 km apart for GOSAT and GOSAT-2).
Thus, the Level 2 XCH4 products of the dataset “Methane data from 2002 to present derived from satellite observations” have spatial resolution sufficently high to assess year-to-year anomalies in XCH4 related to wetland emissions in tropical regions.
3. Spatial and temporal coverage#
The product user guide related to “Methane data from 2002 to present derived from satellite observations” ([6]) was inspected. In terms of spatial/temporal coverage users would use data products derived by algorithms (such as CH4_GOS_OCPR, CH4_GO2_SRPR or XCH4_EMMA) that optimise data availability over regions frequently affected by cloud cover or high aerosol loading. The temporal coverage of algorithms using GOSAT and GOSAT-2 observations (as done by [9]) ranges from 2009 to 2022.
Thus, the level 2 XCH4 products of the dataset “Methane data from 2002 to present derived from satellite observations” have sufficient spatial and temporal coverage to assess year-to-year anomalies in XCH4 related to wetland emissions in tropical regions. In any case, users should consult the documentation as well as the uncertainty and quality flags in the data files as appropriate for their applications.
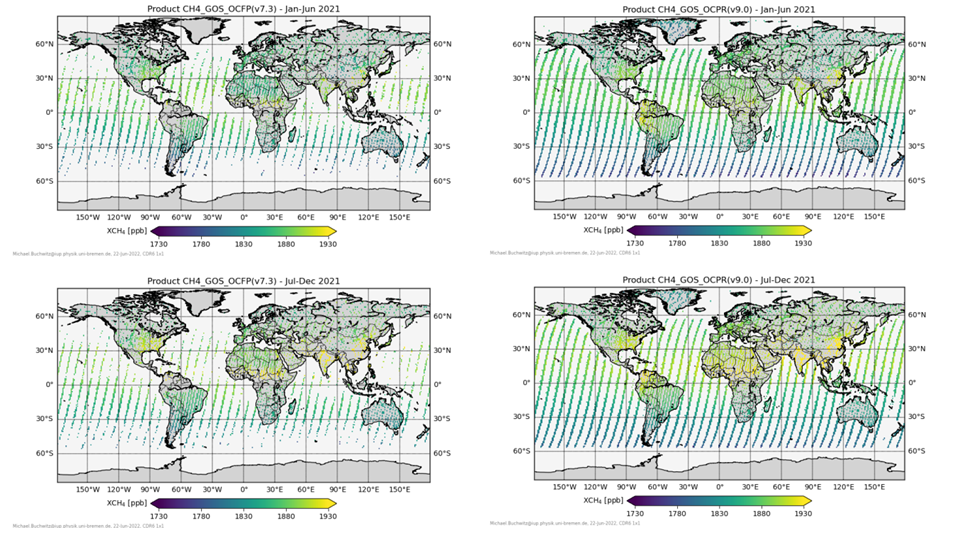
Fig. 3 Figure showing a comparison between FP and PR Level 2 XCH4 products from the University of Leicester GOSAT products from the CDS for January to June 2021 (top) and July to December 2021 (bottom). Right: “CH4_GOS_OCFP algorithm”. Left: “CH4_GOS_OCPR algorithm”. Image adapted from [6] under CC-BY license..#
ℹ️ If you want to know more#
Key resources#
The CDS catalogue entries for the data used were:
Methane data from 2002 to present derived from satellite observations: https://cds.climate.copernicus.eu/cdsapp#!/dataset/satellite-methane?tab=overview
More about wetlands and C3S products that assist wetland conservation:
More about greenhouse gases by the World Meteorological Organization (WMO):
References#
[1] World Meteorological Organization (2023). WMO Greenhouse Gas Bulletin, No. 19, ISSN 2078-0796.
[2] Saunois, M., Stavert, A. R., Poulter, B., Bousquet, P., Canadell, J. G., et al. (2020). The Global Methane Budget 2000–2017. Earth System Science Data, 12, 1561–1623.
[3] Zhang, Z., Poulter, B., Feldman, A.F. et al. (2023). Recent intensification of wetland methane feedback. Nature Climate Change, 13, 430–433.
[4] Ernest N. Koffi et al. (2020). An observation-constrained assessment of the climate sensitivity and future trajectories of wetland methane emissions. Science Advances, 6,eaay4444.
[5] Copernicus Atmosphere Monitoring Service (2020). CAMS global inversion-optimised greenhouse gas fluxes and concentrations.
[6] Buchwitz, M. (2023). Product User Guide and Specification (PUGS) – Main document for Greenhouse Gas (GHG: CO2 & CH4) data set CDR6 (01.2003-12.2021).
[7] Copernicus Climate Change Service, Climate Data Store, (2018): Methane data from 2002 to present derived from satellite observations. Copernicus Climate Change Service (C3S) Climate Data Store (CDS). DOI: 10.24381/cds.b25419f8
[8] Buchwitz, M. (2023). Product Quality Assessment Report (PQAR) – Main document for Greenhouse Gas (GHG: CO2 & CH4) data set CDR6 (01.2003-12.2021).
[9] Parker, R.J., Boesch, H., McNorton, J., Comyn-Platt, E., Gloor, M., Wilson, C., Chipperfield, M.P., Hayman, G.D., Bloom, A.A. (2018). Evaluating year-to-year anomalies in tropical wetland methane emissions using satellite CH4 observations. Remote Sensing of Environment, 211, 261-275.
[10] Maasakkers, J. D., Jacob, D. J., Sulprizio, M. P., Scarpelli, T. R., Nesser, H., Sheng, J., Zhang, Y., Lu, X., Bloom, A. A., Bowman, K. W., Worden, J. R., and Parker, R. J. (2021). 2010–2015 North American methane emissions, sectoral contributions, and trends: a high-resolution inversion of GOSAT observations of atmospheric methane. Atmospheric Chemistry and Physics, 21, 4339–4356.
[11] Chevallier, F. et al. (2020). User Requirements Document (URD), ESA Climate Change Initiative (CCI) GHG-CCI project, Version 3.0, pp.42.