

1.6.1. Sea level measurements accuracy assessment from Satellite (observations) in the coastal zone#
Production date: 29-08-2024
Modification date: 28-02-2025
Produced by: Antonio Sánchez-Román IMEDEA (CSIC-UIB)
🌍 Use case: Studying sea level retrieval in the coastal band#
❓ Quality assessment questions#
How accurate are satellite-derived sea level anomaly measurements in the coastal band of the European Seas?
Can we use satellite-derived sea level anomalies to monitor the long-term evolution of sea level in the coastal band of the European Seas?
Traditional altimetry has been often unable to produce meaningful signals of sea level change in the coastal zone due to the typically shallower water, bathymetric gradients and shoreline shapes, among others [1], [2]. Actually, satellite sea level products are not optimized for the coastal band promoting larger errors in the retrieval of sea level with regard to the open ocean. Nevertheless, the monitoring of sea level changes in coastal areas is an important societal issue [3]. Thus, most of the efforts of the international community in the recent past have been focused on the research and development of techniques for coastal altimetry, with substantial support from space agencies such as the European Space Agency (ESA), the Centre National d’Études Spatiales (CNES) and other research institutions [4]. Efforts of the coastal altimetry community are aimed at extending the capabilities of current altimeters closer to the coastal zone. This includes the application of improved geophysical corrections, data recovery strategies near the coast using new editing criteria and high-frequency along-track sampling associated with updated quality control procedures [1]. As a result, regional altimeter products focused on the coastal zone have been developed over the last years [3]. These products are disseminated to both the international scientific community and society through regular specific coastal altimetry workshops. Different metrics are used to assess the quality of satellite sea level data. They mainly consist in the analysis of the sea level anomaly (SLA) field at different steps of the processing, checks of the consistency of the SLA along the tracks of different altimeters and between gridded and along-track products, and comparisons with external in situ measurements [5]. In situ and satellite observations are complementary and are often assumed to observe the same signals [6]. In coastal areas, tide gauge measurements are commonly used (e.g., [7]). In this context, this notebook aims to evaluate the performance of satellite global sea level gridded products in the retrieval of sea level in the coastal band of the European Seas over the period 1993-2020. This assessment is based on the analysis conducted in [8] from satellite sea level data.
📢 Quality assessment statement#
These are the key outcomes of this assessment
The mean value of the rms difference between the vDT2021 satellite dataset and tide gauges along the coastal band of the European Seas is 4.35 cm, the variance of the differences (satellite – tide gauge) is 19 cm² whilst the variance of the satellite and tide gauge datasets are 89 cm² and 79 cm², respectively. Thus, this dataset properly captures the sea level in the coastal region of the European Seas and its variability when compared with in-situ tide gauge data. In addition, the mean distance between the location of the tide gauges and the corresponding satellite data with the highest correlation is 87 km.
The mean value of the rms difference between the vDT2018 version and tide gauges is 4.41 cm, the variance of the differences (altimetry–tide gauge) is 19 cm², and the mean distance between the location of the tide gauge and the corresponding satellite data is 90 km. Thus, compared to its predecessor, vDT2018, the vDT2021 dataset shows only slight improvements. The average difference with tide gauges decreased by just 1%, and the mean distance between tide gauges and the most correlated satellite data points was reduced by 3% (from 90 km to 87 km), whereas the variance of the differences between the datasets is quite similar.
Consistency between the satellite dataset vDT2021 and the tide gauge data shows spatial variability. In the central and eastern Baltic Sea, differences are under 5%, confirming the accuracy of the satellite corrections applied in this area. However, in regions connected to the North Atlantic, such as the Strait of Gibraltar and along the Atlantic shore, discrepancies increase, ranging between 20% and 50%. This could be due to inaccuracies in corrections (i.e. ocean tide and DAC) applied to the satellite data, as well as greater variability in non-tidal sea level changes. The Norwegian Sea shows better results than those obtained for the Atlantic shore with consistency values ranging between 15 % and 30 %, except for the south-western part of Norway where even better values ranging between 5 % and 15% are obtained providing accurate sea level measurements when compared with tide gauges.
Linear trends derived from the vDT2021 satellite dataset indicate a consistent sea level rise along the European coasts and the western Mediterranean, with values ranging from 2.60 to 3.80 mm yr⁻¹ and a mean trend for the whole domain of 3.13 mm yr⁻¹. In contrast, trends computed from tide gauge records display a more heterogeneous spatial pattern, with values ranging between 1.30 and 3 mm yr⁻¹ and a mean trend for the whole domain of 1.96 mm yr⁻¹. These results provide further evidence of the European seas coastal sea level rise, including the westernmost part of the Mediterranean Sea. Overall, linear trend differences (satellite – tide gauge) for the vDT2021 dataset vary, in absolute value, from 0.03 to 2.65 mm yr⁻¹, with an average of 1.40 mm yr⁻¹. These low discrepancies corroborate the agreement and complementarity of the two techniques to measure sea level variability in the coastal zone. However, this translates into vDT2021 satellite measurements not being accurate enough in the coastal zone.
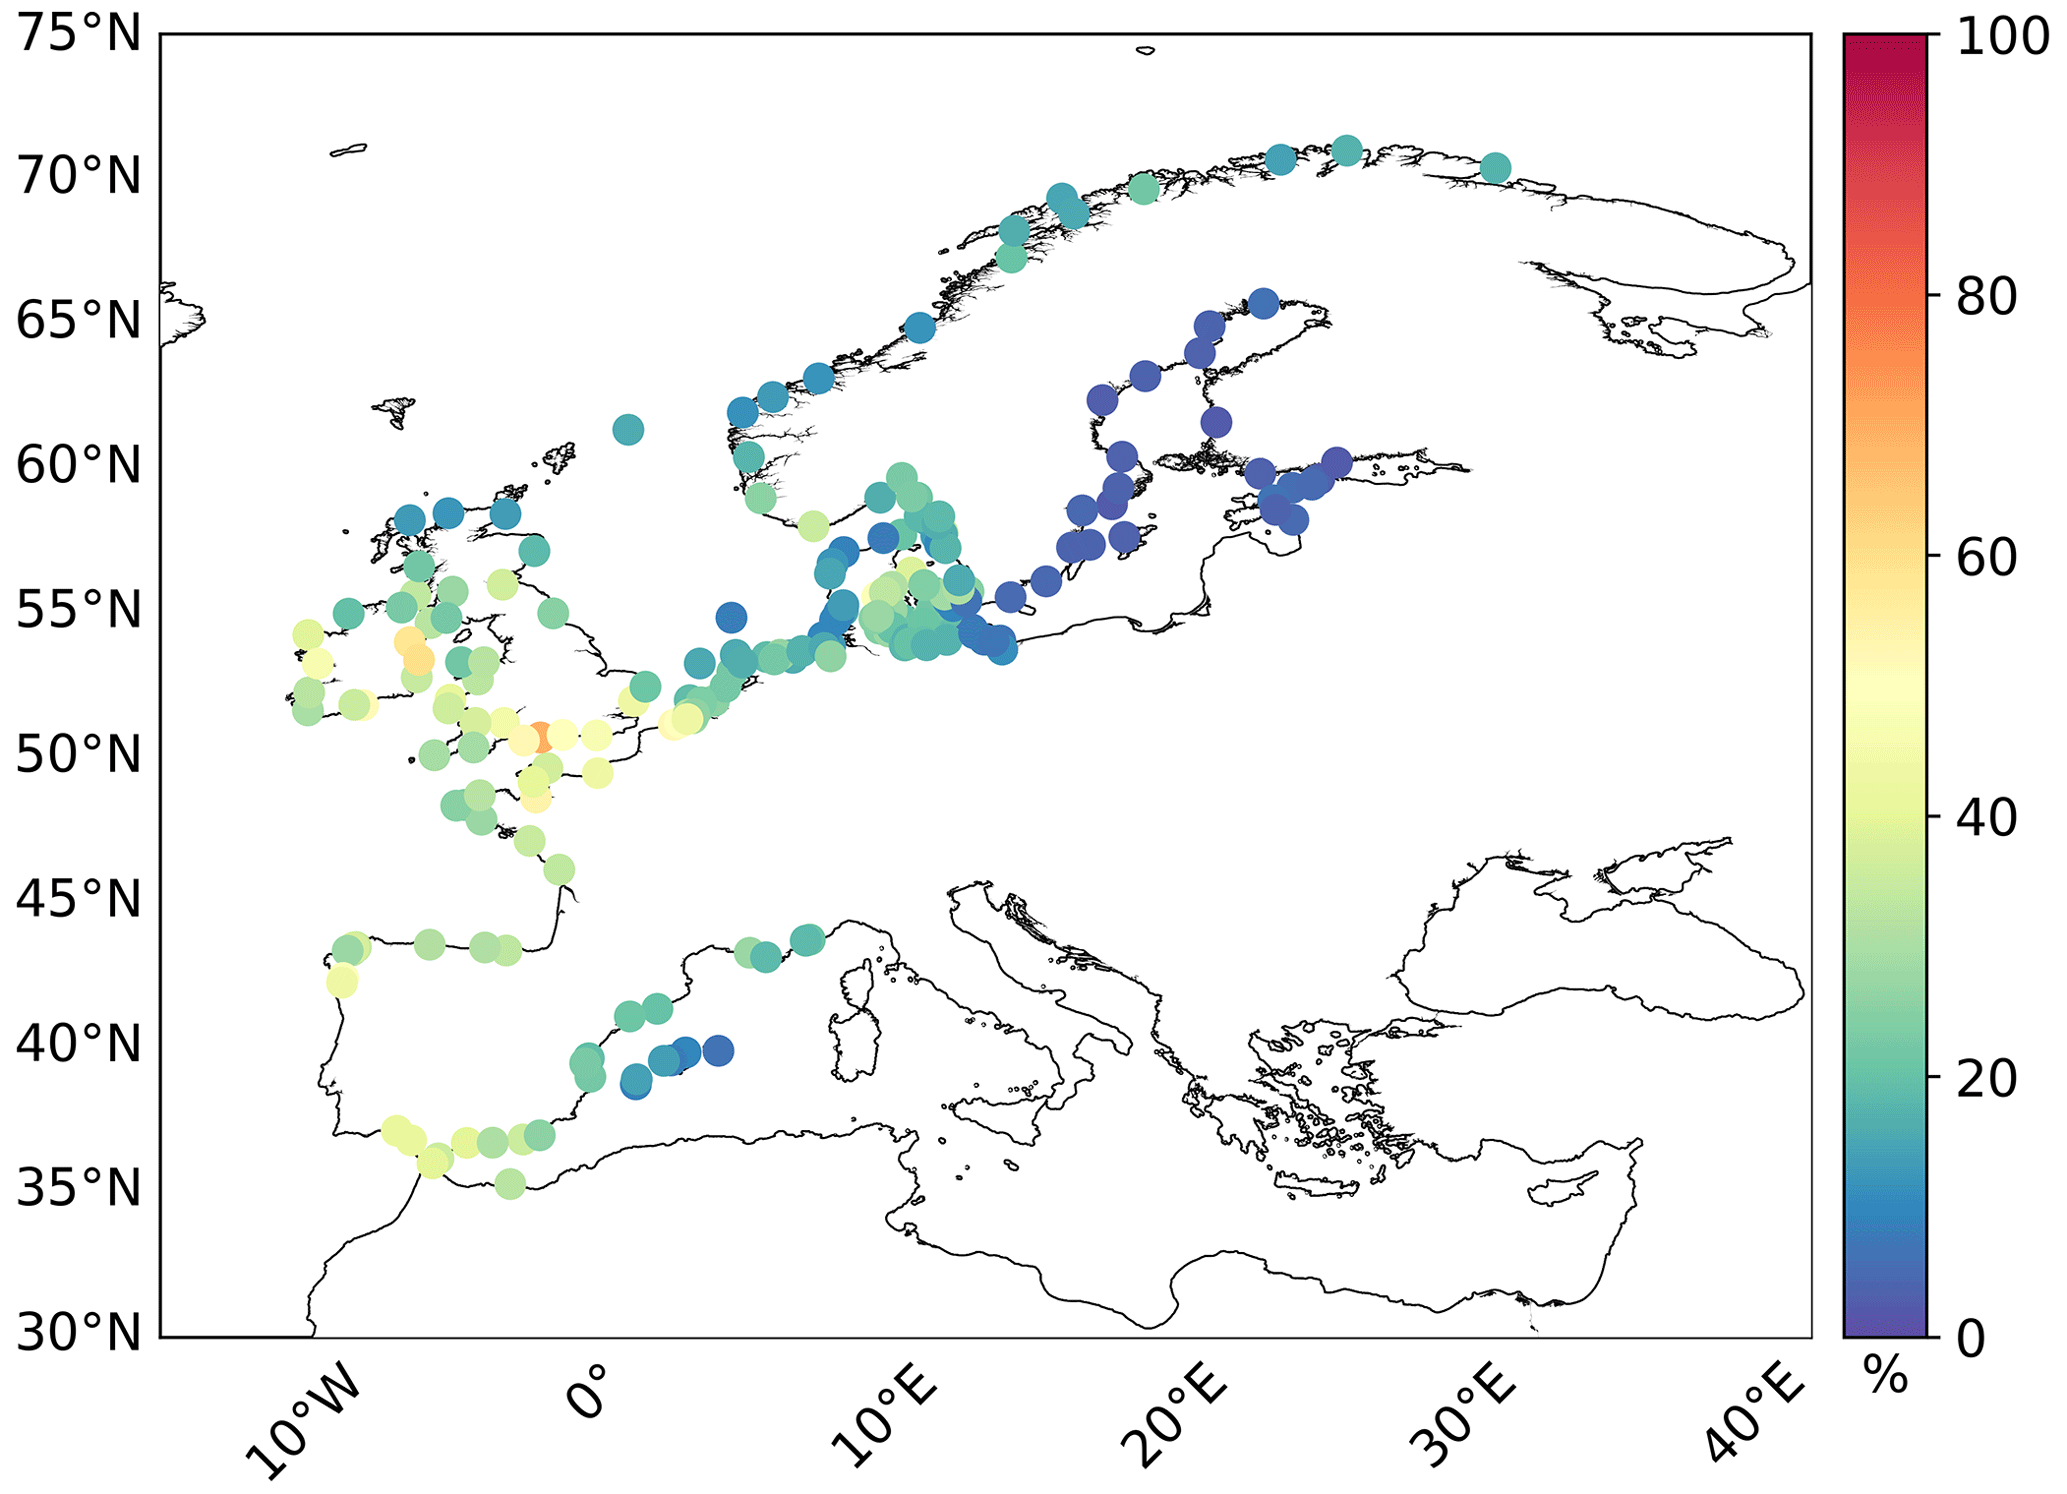
Figure 1. Location of the tide gauges along the European coasts and the western Mediterranean Sea used for a comparison with satellite data. Colours indicate the mean square differences between the tide gauge and satellite sea level (vDT2021 version). Units are the percentage of the tide gauge variance.
📋 Methodology#
We provide an assessment of the accuracy of satellite-derived sea level observations in the coastal zone of the European Seas over the period 1993-2020 through their comparison with in situ tide gauge records located along the European coasts. The Climate Data Store (CDS) catalogue entry used is the following:
On the time of podruction, two data versions are available in the CDS: vDT2018 and vDT2021. The improvements in the latest (vDT2021) dataset in the retrieval of sea level in the coastal band of the European Seas respect to the previous version (vDT2018) is investigated. SLA L4 satellite-derived from the CDS are provided on regular grids with nominal spatial resolutions of 0.25 x 0.25 degrees.
Other entries used for the assessment:
Before they can be compared with satellite data, tide gauge measurements have to be processed to remove oceanographic signals whose temporal periods are not resolved by satellite sea level data, thus avoiding important aliasing errors [1]. In the following there are summarised the corrections applied to the tide gauge records:
Correction of oceanic tidal effects by filtering tidal components (mainly diurnal and semidiurnal tidal constituents). The u-tide software [12] is used. The annual and semiannual frequencies, mainly driven by steric effect, are kept in the tidal residuals since they are included in the satellite data.
Removal of the atmospheric induced sea level variability caused by the action of atmospheric pressure and wind [13], [14]. The same dynamic atmospheric correction (DAC) as for satellite data is applied for the sake of consistency. The 6-hourly fields of this correction, available from the Archiving, Validation and Interpretation of Satellite Oceanographic Data (AVISO) website [DAC entry], are used. For each tide gauge site, the nearest grid point was selected and used to remove the atmospherically induced sea level from observations, previously converted into 6-hourly records [15].
Correction of vertical movements associated with glacial isostatic adjustment (GIA). GIA is regarded as the only source of vertical land motions. Its effects are removed from the sea surface height (SSH) records, previously averaged into daily data, by using the Peltier mantle viscosity model (VM2) [16], [17].
The comparison method of satellite data with tide gauges consists in collocating both datasets in time and space. As a first step, a 15 day low-pass LOESS filter is applied to satellite and tide gauge time series to remove the high frequencies that cannot be resolved by the satellite data [2], [18], [19]. Then, the correlations between each tide gauge record and SLA time series corresponding to grid points within a radius of 1 degree around the tide gauge site is computed and the most correlated altimetry point is chosen. Only long-term monitoring stations with a lifetime of more than 3 years are used to allow statistical significance. Statistical analyses are performed using all available data pairs (satellite – tide gauge) in terms of the root mean square (rms) difference and variance of the time series. Consistency between the satellite dataset and the tide gauge data is computed from Eq. (1) in [2]. It is expressed as the mean square differences between both datasets, computed as the variance of the differences (satellite – tide gauge), in terms of percentage of the tide gauge variance.
The results are organised in the following steps, which are detailed in the sections below:
1. Performance of vDT2021 dataset in the retreival of sea level in the coastal band
2. Improvement in vDT2021 version over vDT2018 dataset
3. Performance of vDT2021 dataset in monitoring the long-term evolution of sea level
📈 Analysis and results#
This notebook does not include code. It is a literature review based on the results reported in [8]
1. Performance of vDT2021 dataset in the retreival of sea level in the coastal band#
The mean value (Table 1) of the rms difference between the vDT2021 satellite dataset and tide gauges is 4.35 cm, the variance of the differences (satellite – tide gauge) is 19 cm², whereas the variance of the satellite and tide gauge datasets are 79 cm² and 89 cm², respectively. Thus, this dataset properly captures the sea level in the coastal region and its variability when compared with in-situ tide gauge data. In addition, the mean distance between the location of the tide gauge and the corresponding satellite data with the highest correlation is 87 km. Overall, consistency (Figure 1) between the vDT2021 satellite dataset and the tide gauge data (expressed according to [2] as the mean square differences between both datasets in terms of percentage of the tide gauge variance) shows spatial variability with values lower than 5 % in the central and eastern parts of the Baltic Sea, emphasizing the precision of the correction applied to the satellite data in the basin that provides accurate sea level measurements when compared with tide gauges. However, they reach poorer values between 20 % and 30 % for stations located in the connection region with the North Atlantic Ocean. In addition, consistency values are between 20 % and 50 % for most of the stations located along the Atlantic shore; this includes the Strait of Gibraltar area. Such a large error could be related to imprecisions in the correction applied (i.e. ocean tide and DAC) to the satellite data [2], [9], [10] and to a larger non-tidal variance with respect to that found in the Baltic Sea [11]. Finally, the Norwegian Sea shows consistency values better than those obtained for the Atlantic shore ranging between 15 % and 30 %, except for the south-western part of Norway where values between 5 % and 15% are found providing accurate sea level measurements when compared with tide gauges.
Table 1. Intercomparison of vDT2021 and vDT2018 satellite dataset (SAT) and tide gauge (TG) data from the European coasts in terms of the rms differences (cm) and variance (cm²) of the differences between the datasets. The mean distance between tide gauges and the most correlated gridded satellite points used in the computation is displayed. The common tide gauge stations for the vDT2021 and vDT2018 datasets were used. Finally, the improvement (%) of the vDT2021 dataset with respect to the previous vDT2018 version is also displayed.
vDT2021 |
vDT2018 |
vDT2021 improvement |
|
|---|---|---|---|
rms diff. (cm) |
4.35 |
4.41 |
1% |
var. TG (cm²) |
89 |
89 |
no improvement |
var. SAT (cm²) |
79 |
78 |
no improvement |
var. TG-SAT (cm²) |
19 |
19 |
no improvement |
distance TG (km) |
87 |
90 |
3% |
2. Improvement in vDT2021 version over vDT2018 dataset#
The mean value of the rms difference between the vDT2018 satellite dataset and tide gauges (Table 1) is 4.41 cm, the variance of the differences (satellite – tide gauge) is 19 cm² , and the mean distance between the location of the tide gauge and the corresponding satellite data is 90 km. If these results are compared with those reported above for the comparison using the vDT2021 satellite dataset, it can be observed that the latter only improves the previous vDT2018 version in terms of the errors with tide gauges that are reduced by 1 % and the mean distance between the most correlated satellite point and tide gauges, reduced by 3 %, whereas the variance of the differences between the datasets is quite similar. This fact is reflected in the spatial distribution of the differences between vDT2021 and vDT2018 consistency with tide gauges (Figure 2). A better performance of the vDT2021 dataset is obtained at the connection region between the Baltic Sea and the eastern North Atlantic Ocean and in parts of the Atlantic shore (coasts of United Kingdom and France). There is a degradation of the vDT2021 dataset in most of the stations located in the western Mediterranean Sea and the southern coasts of Spain; and in some stations located on the coasts of France, England and Ireland. Also, negligible discrepancies between the two versions are found in the Baltic Sea. A degradation of the vDT2021 dataset is observed in most of the stations located in both the North-West Shelf (NWS) area (southern coasts of the North Sea, see Figure 2 in [2] for the location of this region) and the Norwegian Sea.
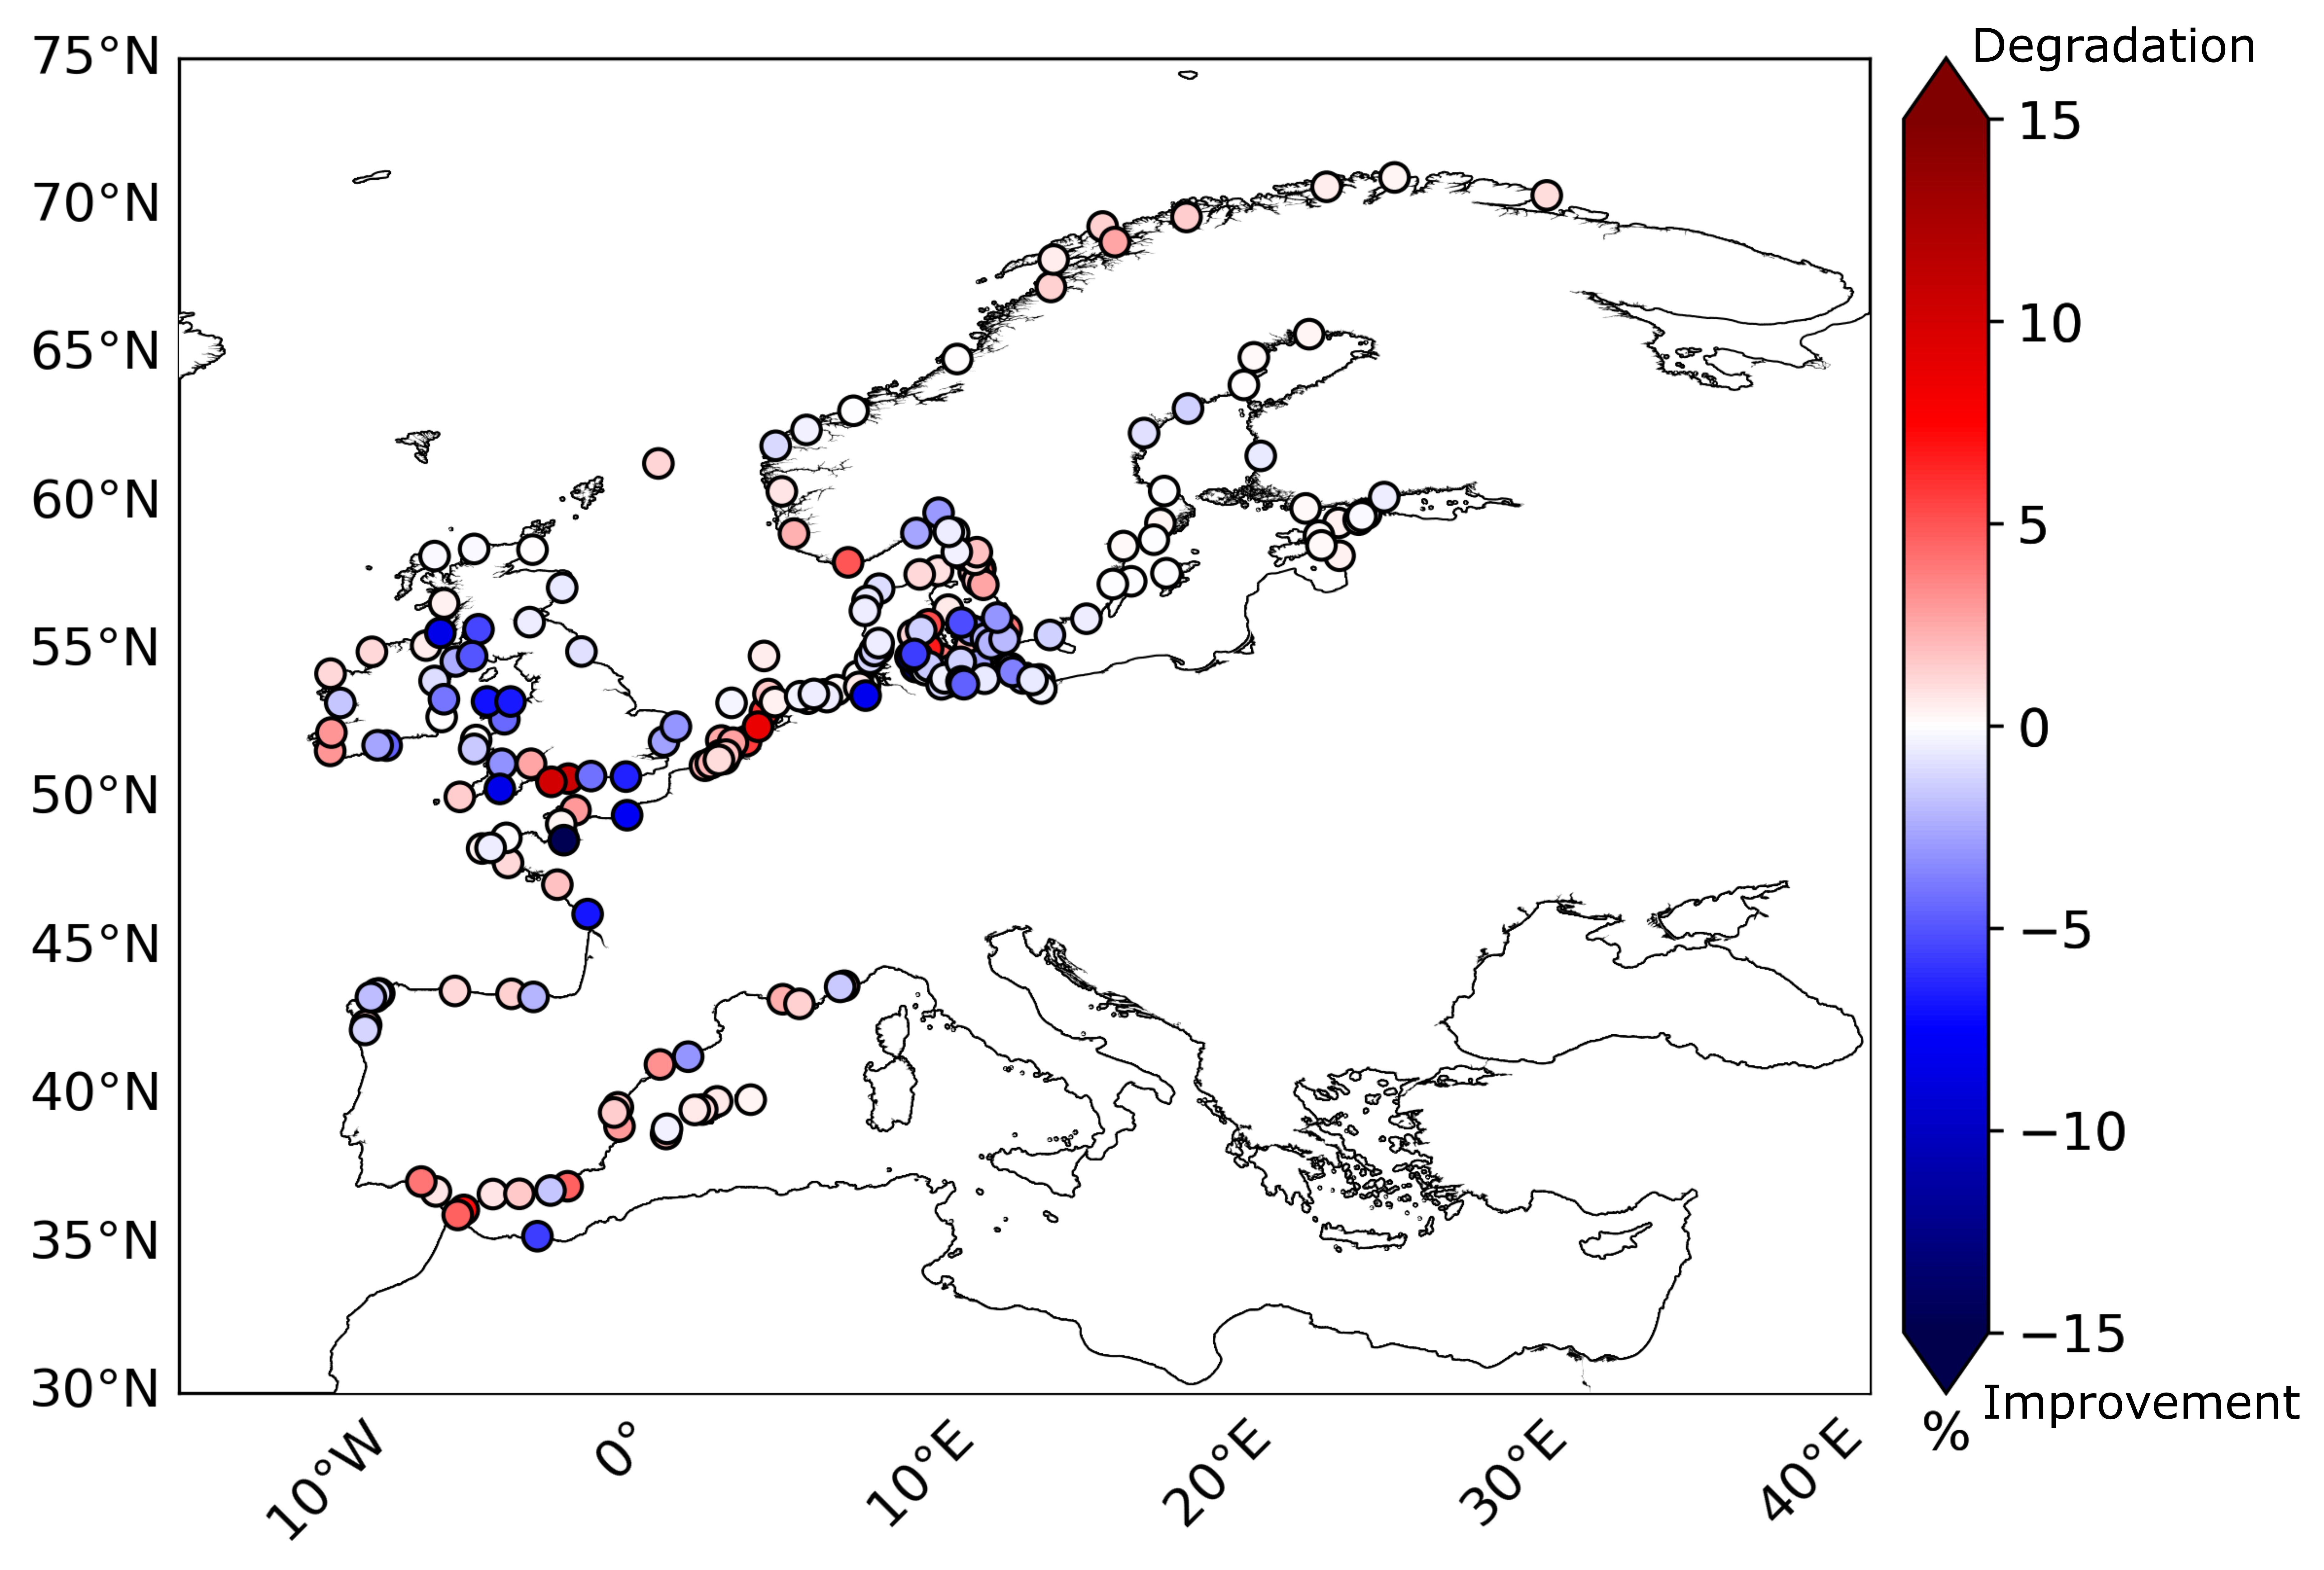
Figure 2. Spatial distribution of the differences (vDT2021 minus vDT2018) for the mean square differences between the tide gauge and satellite sea level data. Units are the percentage of the tidal variance. Blue colours denote an improvement in the vDT2021 dataset, whilst red colours indicate its degradation with respect to the vDT2018 version.
3. Performance of vDT2021 dataset in monitoring the long-term evolution of sea level#
The analyses described above were repeated for a specific time period spanning 20 years: from January 2000 to December 2019. Tide gauge time series with valid data within such a time interval were considered, allowing of the intercomparison satellite – tide gauges for long-term time series with the same length. Moreover, only tide gauge time series with at least 99 % of valid data were used in order to allow the analysis of linear trends. This reduced the original tide gauge dataset to a subset of 27 stations mainly located in the northern half of the Baltic Sea (70 % of stations) with sparse stations distributed along the coasts of France and Spain (Figure 3). Linear trends based on monthly observations at each tide gauge site computed from the vDT2021 satellite dataset (Figure 3, upper panel) show a homogeneous spatial pattern with overall values ranging from 2.60 to 3.80 mm yr⁻¹ in the Baltic and Mediterranean seas and between 2.40 and 3.40 mm yr⁻¹ along the North Atlantic European coasts. This promotes a mean trend for the whole domain of 3.13 mm yr⁻¹. Linear trends computed from tide gauges (Figure 3, lower panel) exhibit a more heterogeneous spatial pattern with values ranging between less than 1 mm yr⁻¹ for some stations located in the Baltic Sea and 5.06 mm yr⁻¹ for a station located in the western Mediterranean Sea. However, most of the tide gauge stations present trend values ranging from 1.30 to 3 mm yr⁻¹ with a mean trend for the whole domain of 1.96 mm yr⁻¹.
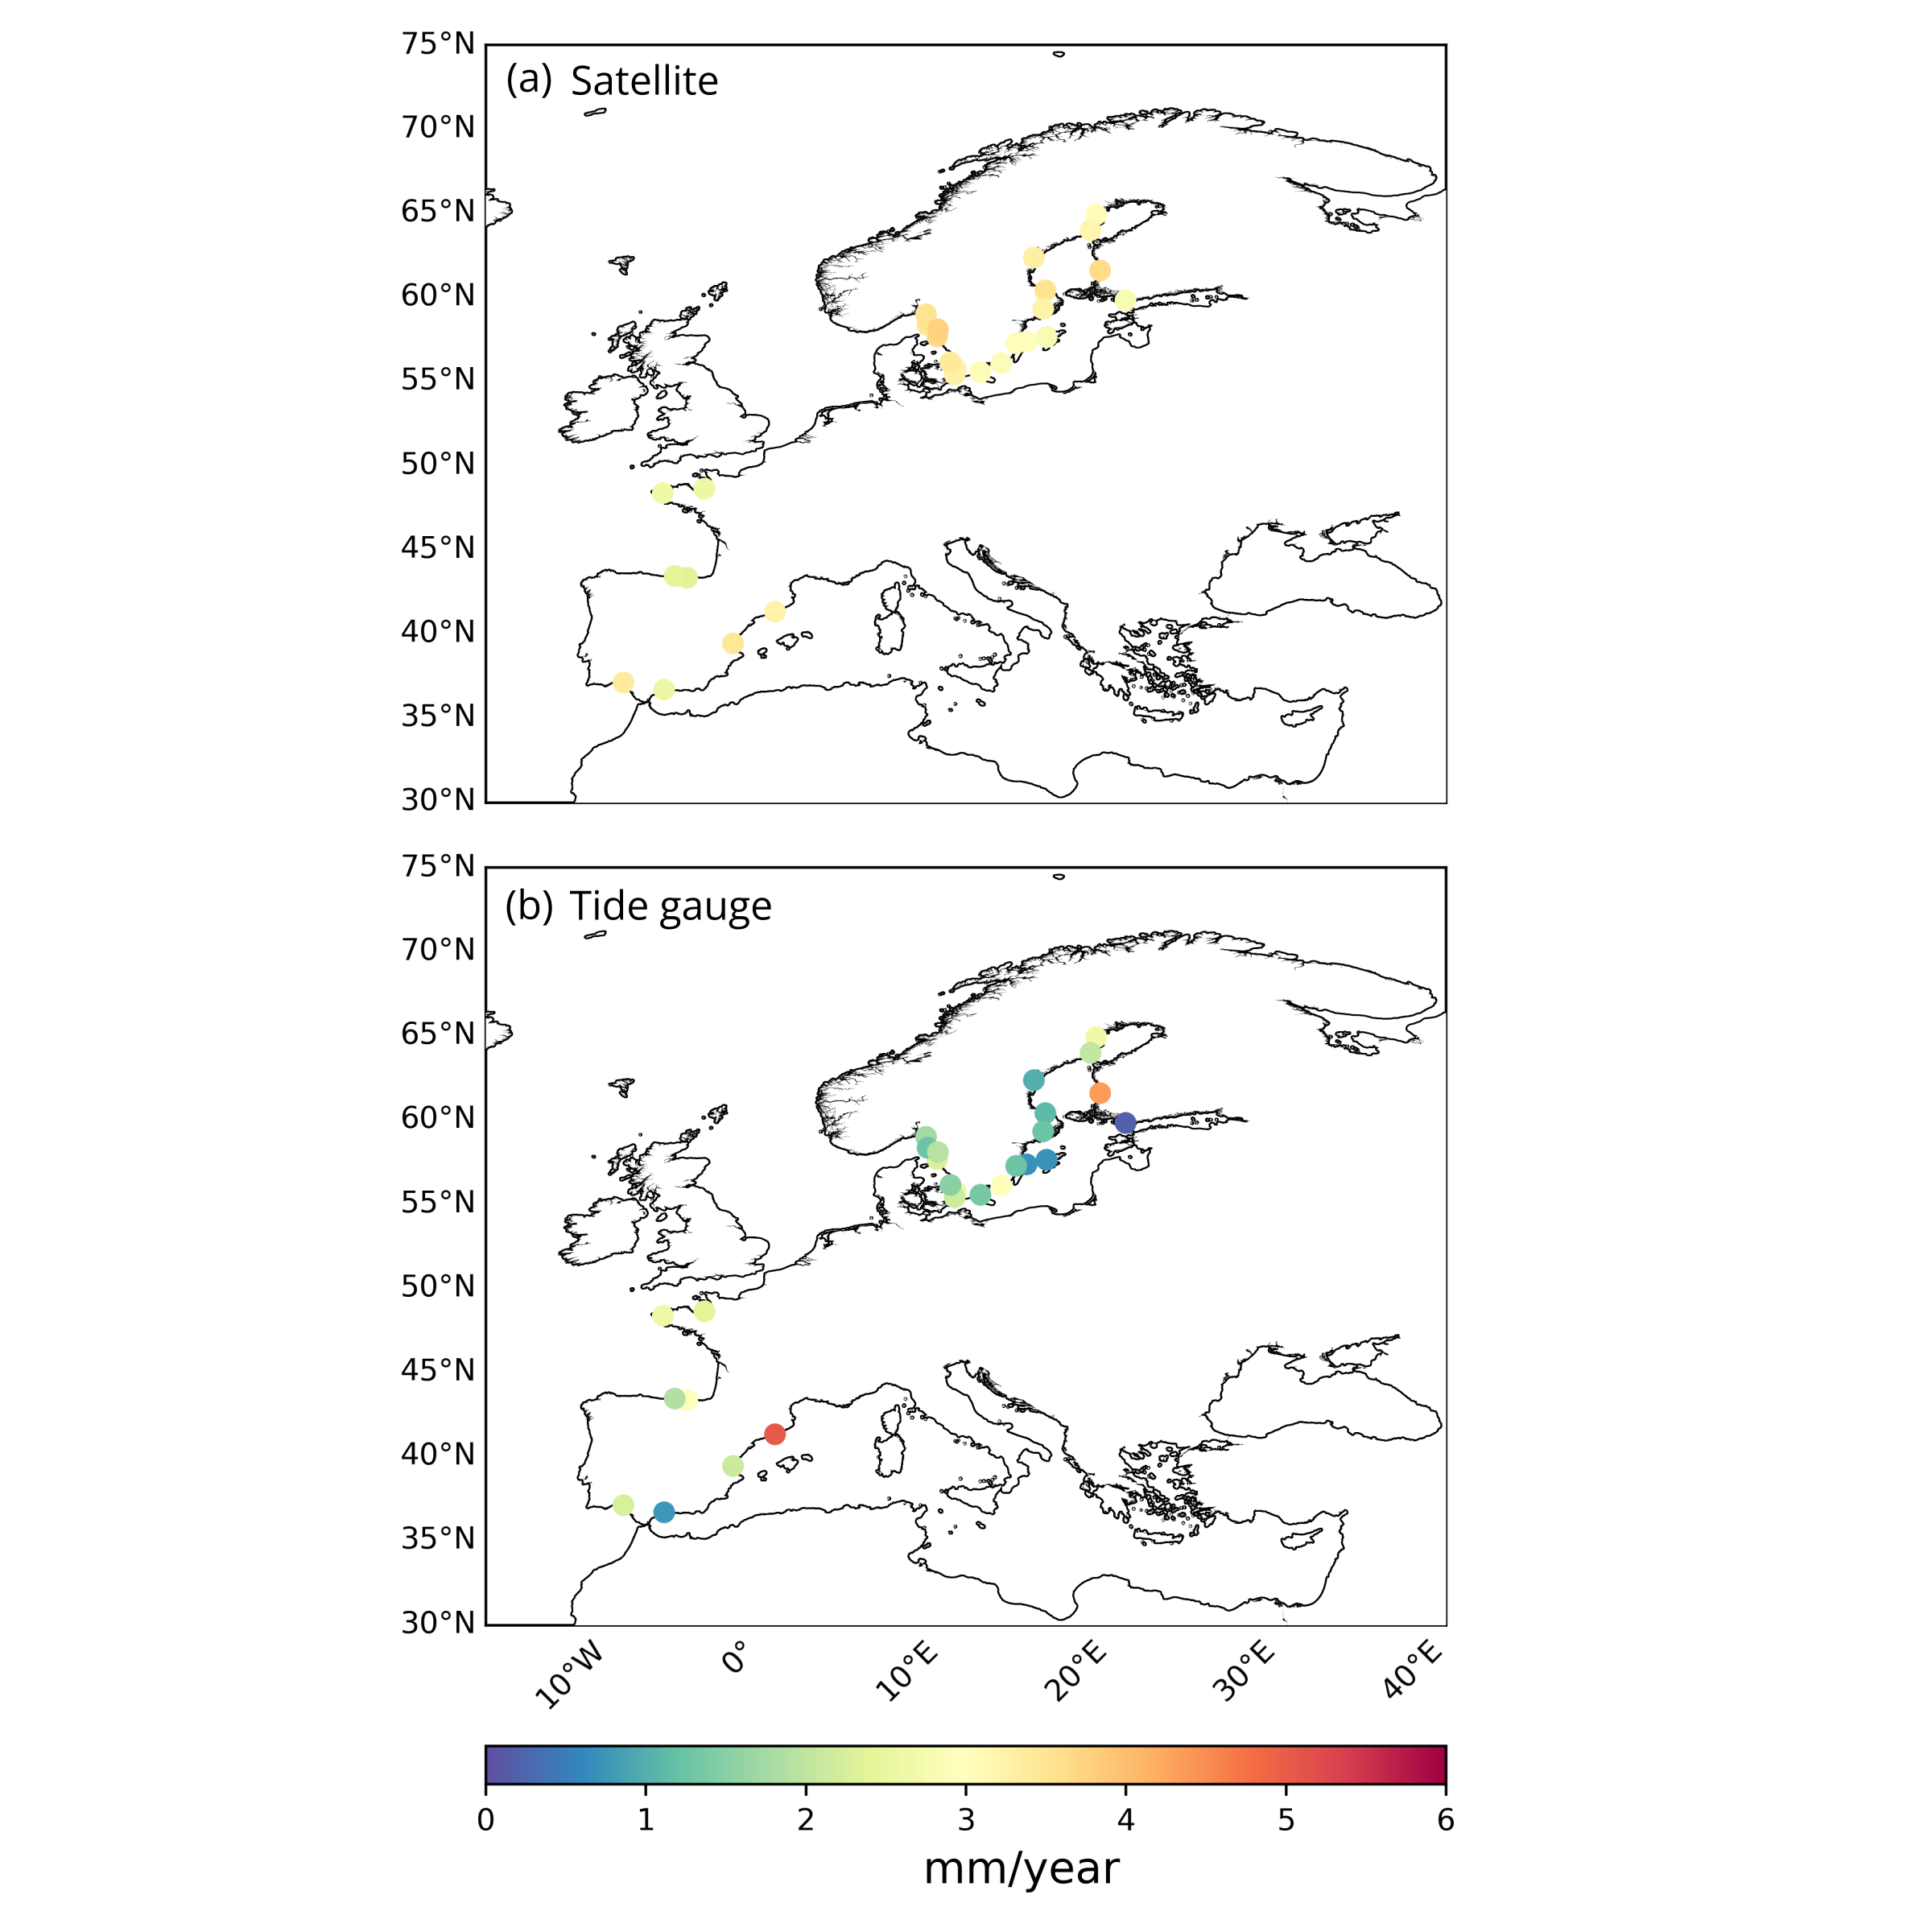
Figure 3. Spatial distribution of linear trends (mm yr⁻¹) for satellite (a) and tide gauge (b) data computed from monthly averaged data for the 20-year time period from January 2000 to December 2019. The vDT2021 dataset has been used.
Trends computed from vDT2021 dataset are on average around 1.2 mm yr⁻¹ larger than those obtained from tide gauges. These discrepancies could be attributed to the heterogeneous distribution of both datasets and also the crustal land uplift due to postglacial rebound resulting from the last glacial age affecting the Baltic Basin, where most of the tide gauge stations are located. This translates into vDT2021 satellite measurements not being accurate enough in the coastal zone. These results provide further evidence, if needed, of the European seas coastal sea level rise, including the westernmost part of the Mediterranean Sea. Overall, linear trend differences (satellite – tide gauge) for the vDT2021 dataset varying, in absolute value, from 0.03 to 2.65 mm yr⁻¹, with an average of 1.40 mm yr⁻¹ are obtained (Figure 4). These discrepancies are lower than 1.5 mm yr⁻¹ on average and corroborate the agreement and complementarity of the two techniques to measure sea level variability in the coastal zone. However, Figure 4 displays an overall overestimation of trends from vDT2021 satellite data in the whole domain except for three tide gauge sites located on the Atlantic Spanish coast, the eastern side of the Baltic Sea, and the western Mediterranean Sea. The differences in trend could be attributed to the aforementioned factors rendering satellite measurements not accurate enough in the coastal zone.

Figure 4. Spatial distribution of the differences in linear trends (mm yr⁻¹) between the vDT2021 satellite and tide gauge sea level computed for the 20-year time period from January 2000 to December 2019. Blue (red) colours denote a larger (lower) satellite linear trend.
Linear trends computed from the vDT2018 dataset (figure not shown) exhibit quite a similar spatial pattern to that reported for the vDT2021 version with overall values ranging from 2.40 to 3.60 mm yr⁻¹ in the Baltic and Mediterranean seas and between 2.10 and 2.85 mm yr⁻¹ along the North Atlantic European coasts. This promotes a mean trend for the whole domain of 2.85 mm yr⁻¹. Thus, some differences in range are observed between the two versions, with a lower variability observed for the vDT2018 dataset. This fact has an impact on the spatial distribution of the differences between the vDT2021 and vDT2018 versions (Figure 5). It depicts a homogeneous spatial pattern with overall larger trends for the vDT2021 dataset except for a tide gauge station located in the connection region between the Baltic Sea and the eastern North Atlantic Ocean. Figure 5 also reveals, when making a comparison with linear trends from tide gauges, that the vDT2021 dataset presents larger differences with tide gauges with respect to the vDT2018 version in the whole domain.

Figure 5. Panel b of Figure 5 from [8]. Spatial distribution of the differences (vDT2021 minus vDT2018 satellite dataset) for linear trends (mm yr⁻¹) for satellite data. Monthly averaged data for the 20-year time period from January 2000 to December 2019 have been used. Blue (red) colours denote lower (larger) trends for the vDT2021 dataset.
ℹ️ If you want to know more#
Key resources#
CDS entry: “Sea level gridded data from satellite observations for the global ocean from 1993 to present”
Product User Guide and Specification (PUGS): vDT2018 and vDT2021
Copernicus climate change indicators: sea level
References#
[1] Vignudelli, S., Birol, F., Benveniste, J., Fu, L.-L., Picot, N., Raynal, M., and Roinard, H.: Satellite Altimetry Measurements of Sea Level in the Coastal Zone, Surv. Geophys., 40, 1319–1349, https://doi.org/10.1007/s10712-019-09569-1, 2019
[2] Sánchez-Román, A., Pascual, A., Pujol, M.-I., Taburet, G., Marcos, M., and Faugère, Y.: Assessment of DUACS Sentinel-3A Altimetry Data in the Coastal Band of the European Seas: Comparison with Tide Gauge Measurements, Remote Sens., 12, 3970, https://doi.org/10.3390/rs12233970, 2020
[3] Pujol, M.-I., Dupuy, S., Vergara, O., Sánchez Román, A., Faugère, Y., Prandi, P., Dabat, M.-L., Dagneaux, Q., Lievin, M., Cadier, E., Dibarboure, G., and Picot, N.: Refining the Resolution of DUACS Along-Track Level-3 Sea Level Altimetry Products, Remote Sens., 15, 1–30, https://doi.org/10.3390/rs15030793, 2023
[4] Cipollini, P., Calafat, F.-M., Jevrejeva, S., Melet, A., and Prandi, P.: Monitoring sea level in the coastal zone with satellite altimetry and tide gauges, Surv. Geophys., 38, 33–57, https://doi.org/10.1007/s10712-016-9392-0, 2017
[5] CMEMS-SL-QUID: QUID document for Sea Level TAC DUACS products CMEMS-SL-QUID-008-032-068, https://catalogue.marine.copernicus.eu/documents/QUID/CMEMS-SL-QUID-008-032-068.pdf , 2022
[6] Wöppelmann, G. and Marcos, M.: Vertical land motion as a key to understanding sea level change and variability, Rev. Geophys., 54, 64–92, https://doi.org/10.1002/2015RG000502, 2016
[7] Taburet, G., Sanchez-Roman, A., Ballarotta, M., Pujol, M.-I., Legeais, J.-F., Fournier, F., Faugere, Y., and Dibarboure, G.: DUACS DT2018: 25 years of reprocessed sea level altimetry products, Ocean Sci., 15, 1207–1224, https://doi.org/10.5194/os-15-1207-2019, 2019
[8] Sánchez-Román, A., Pujol, M. I., Faugère, Y., and Pascual, A.: DUACS DT2021 reprocessed altimetry improves sea level retrieval in the coastal band of the European seas, Ocean Sci., 19, 793–809, https://doi.org/10.5194/os-19-793-2023, 2023
[9] Pascual, A., Marcos, M., and Gomis, D.: Comparing the sea level response to pressure and wind forcing of two barotropic models: validation with tide gauge and altimetry data, J. Geophys. Res., 113, C07011, https://doi.org/10.1029/2007jc004459, 2008
[10] Laíz, I., Tejedor, B., Gómez-Enri, J., Aboitiz, A., and Villares, P.: Contributions to the sea level seasonal cycle within the Gulf of Cadiz (Southwestern Iberian Peninsula), J. Mar. Syst., 159, 55– 66, https://doi.org/10.1016/j.jmarsys.2016.03.006, 2016
[11] Von Schuckmann, K., Le Traon, P.-Y., Smith, N., et al.: Copernicus Marine Service Ocean State Report, J. Oper. Ocean., 11, S1– S142, https://doi.org/10.1080/1755876X.2018.1489208, 2018
[12] Codiga, D. L.: Unified Tidal Analysis and Prediction Using the UTide Matlab Functions, Technical Report 2011-01, Graduate School of Oceanography, University of Rhode Island, Narragansett, RI, 59 pp., https://www.po.gso.uri.edu/codiga/utide/2011Codiga-UTide-Report.pdf , 2011
[13] Dorandeu, J. and Le Traon, P.-Y.: Effects of global mean atmospheric pressure variations on mean sea level changes from Topex/Poseidon, J. Atmos. Ocean. Technol., 16, 1279–1283, , 1999
[14] Carrère, L. and Lyard, F.: Modeling the barotropic response of the global ocean to atmospheric wind and pressure forcing–comparisons with observations, Geophys. Res. Lett., 30, 1275, https://doi.org/10.1029/2002GL016473, 2003
[15] Marcos, M., Pascual, A., and Pujol, I.: Improved satellite altimeter mapped sea level anomalies in the Mediterranean Sea: A comparison with tide gauges, Adv. Space Res., 56, 596–604, https://doi.org/10.1016/j.asr.2015.04.027, 2015
[16] Peltier, W. R.: Postglacial Variations in the Level of the Sea: Implications for Climate Dynamics and Solid-Earth Geophysics, Rev. Geophys., 36, 603–689, https://doi.org/10.1029/98RG02638, 1998
[17] Peltier, W. R.: Global Glacial Isostasy and the Surface of the Ice-Age Earth: The ICE-5G(VM2) model and GRACE, Ann. Rev. Earth. Planet. Sci., 32, 111–149, https://doi.org/10.1146/annurev.earth.32.082503.144359, 2004
[18] Pascual, A., Boone, C., Larnicol, G., and Le Traon, P. Y.: On the quality of real-time altimeter gridded fields: comparison with in situ data, J. Atmos. Ocean. Technol., 26, 556–569, https://doi.org/10.1175/2008JTECHO556.1, 2009
[19] Ballarotta, M., Ubelmann, C., Pujol, M.-I., Taburet, G., Fournier, F., Legeais, J.-F., Faugère, Y., Delepoulle, A., Chelton, D., Dibarboure, G., and Picot, N.: On the resolutions of ocean altimetry maps, Ocean Sci., 15, 1091–1109, https://doi.org/10.5194/os-15-1091-2019, 2019