

3.1. Assessment of sea level evolution in the Arctic Ocean#
Production date: 08-05-2024
Produced by: IMEDEA (CSIC-UIB) [webpage]
🌍 Use case: Analysis of long-term sea level variability in the Arctic Ocean#
❓ Quality assessment question#
Can we use ORAS5 reanalysis to assess the long-term evolution of sea level in the Arctic Ocean?
The Arctic Ocean has experienced dramatic changes in the last decades due to global warming. Sea level variation is an important indicator of climate change, as it integrates changes of almost all the components in the climate system [1]. Thus, its assessment is crucial for understanding how recent climate change is affecting this region [2]. However, in-situ long sea level records from tide gauges are only available along the coast of Norway and Russia [3][4] so they do not cover the whole region. This problem has been partially solved by the satellite radar altimetry data that covers most parts of the Arctic Ocean but only since early 1990s. Despite this, there are still uncovered areas near the North Pole due to the inclination of altimeters [5]. In addition, satellite observations are not accurate enough in presence of sea ice [5][6]. Thus, reanalysis datasets that assimilate observational data from various sources and cover the whole Arctic Ocean over a longer time period compared with altimeter data seem to be a more reliable choice for studying long-term sea level changes in the region. In this context, this notebook aims to evaluate (i) the suitability of ORAS5 reanalysis to assess the spatiotemporal variability of sea level in the Arctic Ocean at regional scale and (ii) long-term sea level variability in the region observed for the period 1979-2018. This assessment is based on the analysis conducted in [2] from ORAS5 reanalysis data.
📢 Quality assessment statement#
These are the key outcomes of this assessment
The comparison of ORAS5 reanalysis dataset with satellite altimetry data in the region for the period 2003-2014 reveals that ORAS5 closely agrees with observational data. However, there are some biases in the ORAS5 data that must be taken into account. The difference between ORAS5 and satellite data is within ±0.1 m, and ORAS5 overestimates the sea surface height (SSH) in the Nordic Seas (between 0.05 and 0.1 m) and East Siberian Sea (0.05 m), while underestimating it in the Canadian Basin (0.05 m), the Canadian Arctic Archipelago (less than 0.05 m), and north of Greenland (0.1 m).
The time series of average SSH of the Arctic Ocean from ORAS5 data strongly correlates with altimeter data, with a correlation coefficient of 0.81 at a 0.01 significance level.
ORAS5 accurately reproduces the temporal and spatial variation of sea level observed in satellite altimeters in the Arctic Ocean for the period 2003-2014. Thus, it can be used to assess the decadal long-term sea level trend in the region.
ORAS5 reveals a positive sea level trend of 2.3 mm/year in the Arctic Ocean from 1979 to 2018, slightly higher than the global average [7]. Due to the shallow water effect, it is expected that the Arctic sea level will continue to rise at a faster rate than the global mean sea level in the future [5],[8].
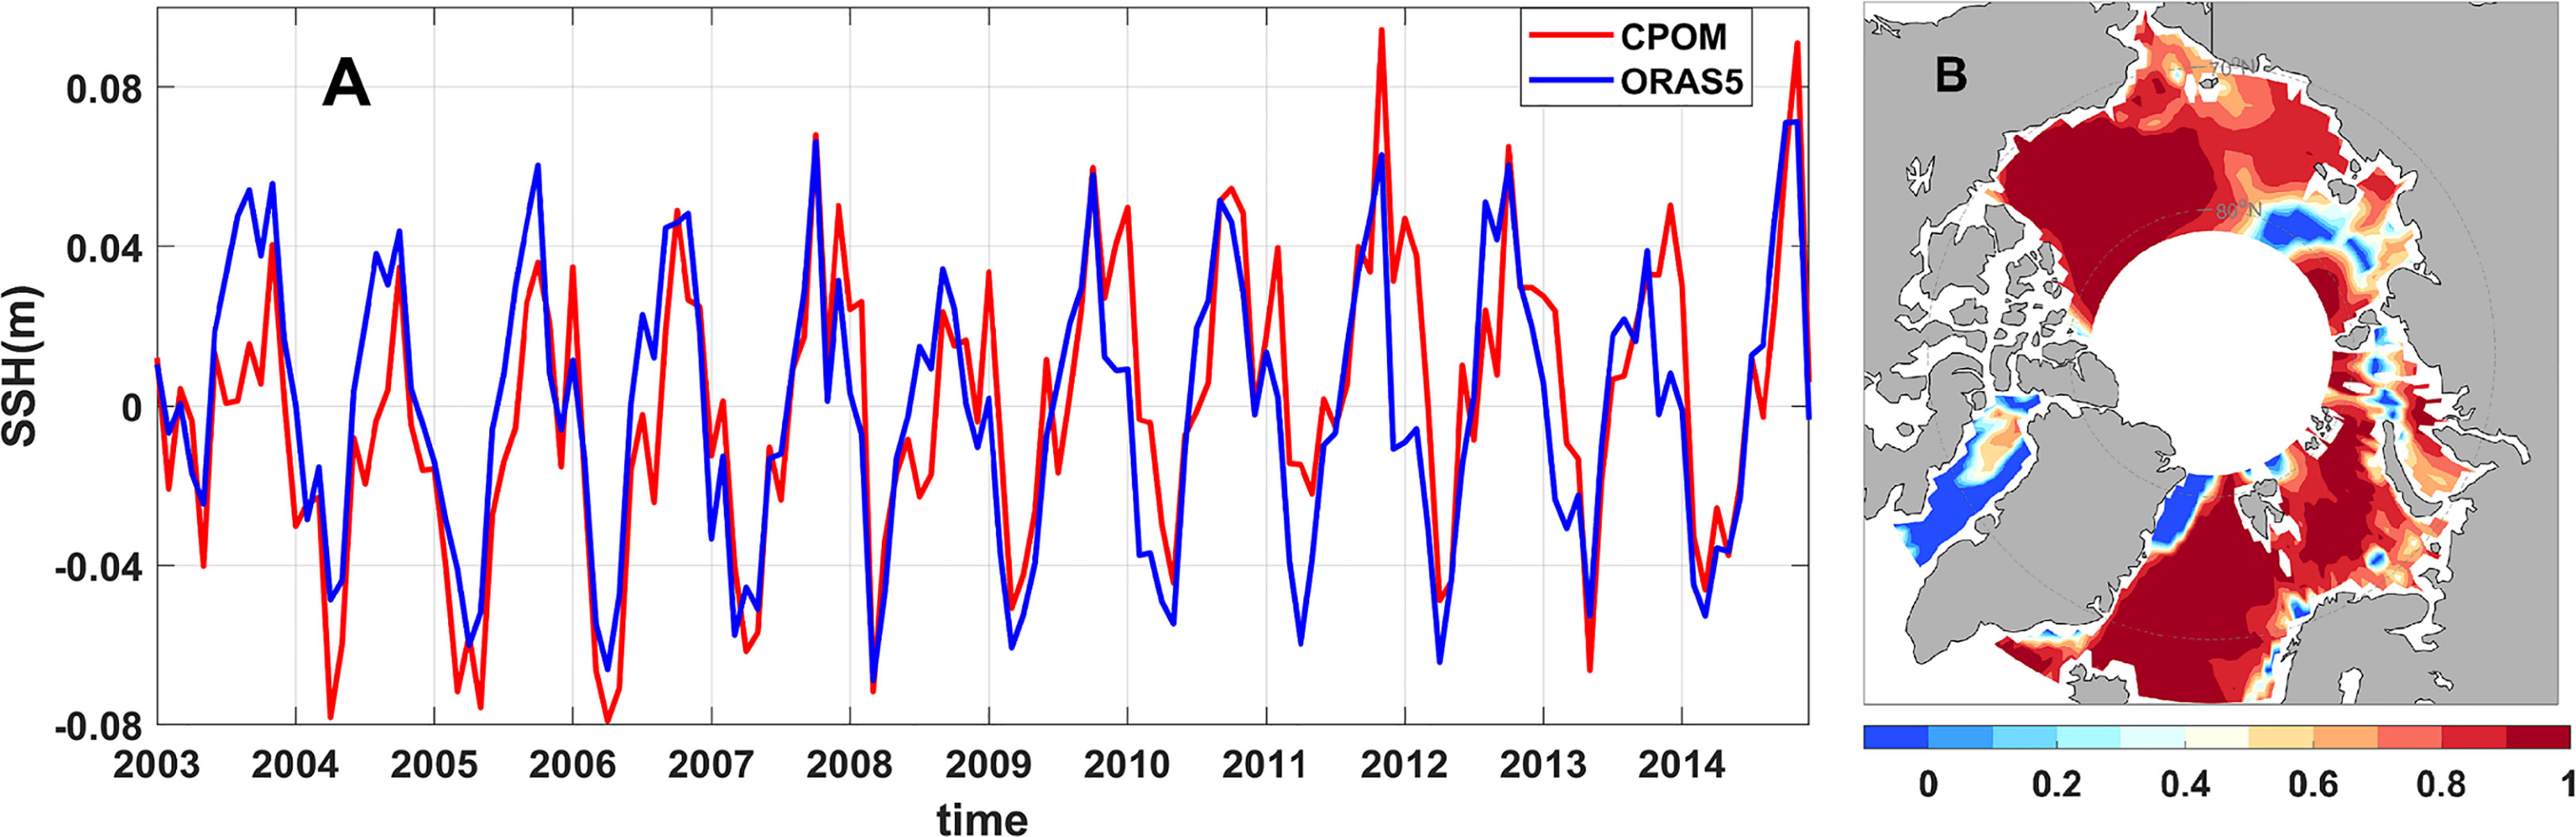
Figure 3 from [2]. (A) Time series of the Arctic average SSH for the period 2003–2014 from ORAS5 (blue curve) and CPOM, an independent dataset based on monthly satellite altimeter observations from the Centre for Polar Observation and Modelling (red curve). (B) The predictive skills of SSH by ORAS5 to CPOM.
📋 Methodology#
This notebook provides in a first step an analysis of the suitability of ORAS5 reanalysis to assess the spatiotemporal evolution of sea level in the Arctic Ocean. It is conducted through its comparison and validation with an independent dataset based on monthly satellite altimeter observations from the Centre for Polar Observation and Modelling (CPOM) at University College London [6]. This validation can be only conducted from year 2003 to 2014 (temporal limitation) due to the CPOM satellite data availability, that does not cover the whole reanalysis time period. The spatial pattern of the mean value (and standard deviation) of SSH from ORAS5 is compared with CPOM data. In addition, a temporal validation is conducted through the analysis of the Pearson linear correlation and root mean square errors of the Arctic basin average sea level from ORAS5 and CPOM time series. In a second step, the long-term sea level variability in the Arctic Ocean is assessed through the analysis of the standard deviation of annual mean SSH from ORAS5 for the period 1979-2018.
The CDS catalogue entry used is the following:
ORAS5 global ocean reanalysis monthly data from 1958 to present [CDS entry]
📈 Analysis and results#
This notebook does not include code. It is a literature review based on the results reported in [2].
Results#
Spatiotemporal sea level variability - the highest SSH is located in the Canadian Basin with a centre in the Beaufort Sea, which is associated with the anticyclonic Beaufort Gyre. High sea levels are also present along the coast of marginal seas. Low sea levels occur in the Eurasian Basin and the Nordic seas, which is related to the cyclonic circulation of ocean. The results show that the ORAS5 dataset reproduces the spatiotemporal patterns of sea level in the Arctic Ocean compared with satellite data. Thus, it can be used to assess the long-term sea level evolution in the basin. However, there are some biases in the ORAS5 data that must be taken into account. The difference between ORAS5 and satellite data is within ±0.1 m, and ORAS5 overestimates the sea surface height (SSH) in the Nordic Seas (between 0.05 and 0.1 m) and East Siberian Sea (0.05 m), while underestimating it in the Canadian Basin (0.05 m), the Canadian Arctic Archipelago (less than 0.05 m), and north of Greenland (0.1 m).
Long-term sea level evolution - the assessment of the long-term sea level variability in the Arctic Ocean reveals positive sea level trends in almost all parts of the basin with a mean rise rate of 2.3 mm/yr for the period 1979-2018 (see Figure below). It is about 0.5 mm/yr larger than the rate of the global mean sea level for a similar time period [7]. The time series of average SSH of the Arctic Ocean indicates that the sea level began to rise in 1995 after reaching its lowest level with a rate of -1 mm/yr since 1979. From that year until 2018 the rate of sea level rise since 1995 increased to 3.7 mm/yr. In addition, due to the shallow water effect, it is expected that the Arctic sea level will continue to rise at a faster rate than the global mean sea level in the future [5],[8]. Positive sea level trends occurred in almost all parts of the Arctic Ocean from 1979 to 2018.The Canadian Basin has the fastest sea level rise, with the Beaufort Sea reaching 9 mm/yr. In addition, this region presents the largest standard deviation (about 11.4 cm), while the Makarov Basin and area north of Ellesmere Island also show significant values (7-8 cm). The East Siberian Sea has moderately larger values (5-6 cm) in the coastal areas.
![[trends]](https://www.frontiersin.org/files/Articles/1197456/fmars-10-1197456-HTML-r1/image_m/fmars-10-1197456-g009.jpg)
Figure 9 from [2]. (A) Rate of SSH for 1979-2018 (mm/yr.). (B) Time series of annual mean (red curve) and linear trend (dashed and solid blue lines) of SSH averaged across the Arctic Ocean for 1979-2018. Rate of SSH for different periods (C) 1979-1995 and (D) 1996-2018.
ℹ️ If you want to know more#
Key resources#
CDS: ORAS5
Dataset documentation: https://www.ecmwf.int/en/elibrary/80763-ocean5-ecmwf-ocean-reanalysis-system-and-its-real-time-analysis-component
Daily figures are available on the ECMWF website for both near Real-Time (NRT) data and the full ORAS5 ocean reanalysis product. The NRT page provides up-to-date daily figures, while the ocean reanalysis page offers daily, monthly, quarterly, and annual averages for the entire dataset.
References#
[1] Legeais, J.-F., Ablain, M., Zawadzki, L., Zuo, H., Johannessen, J. A., Scharffenberg, M.G., et al. (2018). An improved and homogeneous altimeter sea level record from the ESA climate change initiative. Earth System Sci. Data 10 (1), 281–301. doi: 10.5194/essd-10-281-2018
[2] Jin, Y., Chen, M., Yan, H., Wang, T. and Yang, J. (2023). Sea level variation in the Arctic Ocean since 1979 based on ORAS5 data. Front. Mar. Sci. 10:1197456. doi: 10.3389/fmars.2023.1197456
[3] Proshutinsky, A., Ashik, I. M., Dvorkin, E. N., Hakkinen, S., Krishfield, R. A., and Peltier, W. R. (2004). Secular sea level change in the Russian sector of the Arctic ocean. J. Geophys. Research-Oceans 109 (C3), C03042. doi: 10.1029/2003JC002007
[4] Henry, O., Prandi, P., Llovel, W., Cazenave, A., Jevrejeva, S., Stammer, D., et al. (2012). Tide gauge-based sea level variations since 1950 along the Norwegian and Russian coasts of the Arctic ocean: contribution of the steric and mass components. J. Geophys. Res.: Oceans 117 (C6), n/a–n/a. doi: 10.1029/2011jc007706
[5]Cheng, Y., Andersen, O., and Knudsen, P. (2015). An improved 20-year Arctic ocean altimetric Sea level data record. Mar. Geodesy 38 (2), 146–162. doi: 10.1080/ 01490419.2014.954087
[6]Armitage, T. W. K., Bacon, S., Ridout, A. L., Thomas, S. F., Aksenov, Y., and Wingham, D. J. (2016). Arctic Sea surface height variability and change from satellite radar altimetry and GRACE 2003-2014. J. Geophys. Res.: Oceans 121 (6), 4303–4322. doi: 10.1002/2015jc011579
[7] Gregory, J. M., White, N. J., Church, J. A., Bierkens, M. F., Box, J. E., Van den Broeke, M. R.,et al. (2013). Twentieth-century global-mean sea level rise: Is the whole greater than the sum of the parts?. Journal of Climate, 26(13), 4476-4499
[8] Griffies, S. M., Yin, J., Durack, P. J., Goddard, P., Bates, S. C., Behrens, E., et al.(2014). An assessment of global and regional sea level for years 1993-2007 in a suite of interannual CORE-II simulations. Ocean Model. 78, 35–89. doi: 10.1016/ j.ocemod.2014.03.004