

1.4.1. Assessing Fire Radiative Power Consistency from Satellite Observations: A Quality Evaluation of the C3S FRP Dataset over the Canadian Boreal Forests#
Production date: 07-05-2025
Produced by: Vitor Miranda & André Brito (CoLAB +ATLANTIC)
🌍 Use case: Fire Radiative Power consistency assessment#
❓ Quality assessment question#
Are the Fire Radiative Power (FRP) and Active Fire (AF) pixel counts from the C3S Sentinel-3 dataset spatially and temporally consistent with those reported in peer-reviewed literature over the Canadian Boreal Forests?
In this quality assessment, we assess the Fire Radiative Power (FRP, in megawatts (MW)) and Active Fire (AF, pixel counts) derived from the monthly gridded C3S Sentinel-3 product (version 1.2, 0.25° spatial resolution, combining day and night observations) available on the Climate Data Store (CDS) of the Copernicus Climate Change Service (C3S), covering the period January 2020 to February 2025. This dataset will be used to quantify the intensity and spatial distribution of biomass burning events across the Area of Interest (AoI), with the aim of evaluating the fitness of the C3S dataset for applications in forest management, carbon budget monitoring, and regional climate assessment.
The analysis focuses on the Canadian boreal forests, with particular attention to the provinces of British Columbia and Alberta (Figures 1 and 2), which experienced exceptional wildfire activity during the 2023–2024 fire season. Recent “State of Wildfires” reports ([1] and [2]) have consistently identified this region as one of the most extreme wildfire-affected areas on record, with fire carbon emissions during 2023–2024 exceeding nine times the long-term average, unprecedented burned area extent, and fire intensity driven by anomalously high fire weather conditions and an abundance of dry fuels — trends partially attributed to anthropogenic climate change. Focusing on this region therefore allows the global C3S product to be evaluated where fire intensity reached record levels within the C3S observation period, and where improvements in understanding fire radiative power dynamics are particularly urgent and societally relevant. The full C3S record (January 2020 – February 2025) is used for the spatial analysis (Section 3), while the temporal analysis (Section 4) covers the complete calendar years 2020–2024, as 2025 only comprises partial data at the time of writing. The 2023–2024 fire season is the primary focus for contextualisation and comparison with the literature, as it represents the most extreme fire period within the dataset.
The results provided here will be compared with the findings reported in [1] and [2], allowing for an evaluation of the dataset’s consistency and performance relative to previously documented fire patterns over the region.
The main question this quality assessment expects to answer is:
Is the C3S product able to reproduce the patterns and magnitudes of Fire Radiative Power (FRP) and Active Fire (AF) dynamics reported in the cited studies for the Canadian boreal forests?
📢 Quality assessment statement#
These are the key outcomes of this assessment
The C3S FRP dataset shows spatially coherent seasonal patterns of fire activity across British Columbia and Alberta for 2020–2025, with fire activity strongly concentrated during the summer season (JJA) and, to a lesser extent, the shoulder seasons (MAM and SON) — consistent with the expected fire dynamics of boreal ecosystems [1], [2].
Annual Active Fire (AF) pixel counts show high interannual variability, with 2023 as the peak year in both regions: 58856 fire pixels in British Columbia (28.4x the 2020 value) and 57280 fire pixels in Alberta (29.5x the 2020 value). The 95th percentile FRP peaked in 2023 at 65.8 MW in British Columbia and 77.1 MW in Alberta, confirming 2023 as the most active fire year over the period.
Both the C3S dataset and the State of Wildfires reference (Kelley et al., 2025) [2] consistently identify 2023 as the year of exceptional fire activity in Alberta, supporting the temporal consistency of the C3S dataset. The C3S records substantially higher AF pixel counts (~44x for Alberta in 2023) and lower FRP peak intensity values than the reference, reflecting differences in spatial resolution and fire aggregation methodology rather than inconsistency between datasets.
Daily C3S data identified a peak of 40899 active fire pixels on 1 September 2023 in British Columbia, and 12941 fire pixels on 1 July 2023 in Alberta, both during the record-breaking 2023 fire season.
Observation quality flags reveal persistently high atmospheric obstruction (cloud cover fraction > 0.6) across the study region throughout the year, with a modest reduction during JJA in the interior regions — the period of highest fire activity — supporting the reliability of fire detections during the most critical periods.
The short length of the C3S time series (5 years, 2020–2025) precludes the computation of climatologically meaningful standardised anomalies, representing a key limitation of the dataset at its current stage.
The dataset is spatially complete across the study region, with no gaps in satellite coverage detected for any season or year analysed.
📋 Methodology#
1. Data Overview, download and Area of Interest (AoI) definition
3. Spatial analysis, averaged maps of fire radiative power and active fire for each season Satellite-derived Fire Radiative Power (FRP) and Active Fire (AF) pixel datasets from 2020 to 2025 were used to assess seasonal spatial patterns of fire activity across Canadian boreal forests, British Columbia and Alberta. Seasonal aggregations were performed for December–January–February (DJF), March–April–May (MAM), June–July–August (JJA), and September–October–November (SON) to compare fire activity spatially within and across years. Spatial comparison was based on seasonal absolute Active Fire (AF) counts. Standardised anomaly analysis were considered but not performed, as the 5-year length of the C3S time series is insufficient to derive climatologically meaningful anomalies.
4. Temporal analysis of fire radiative power and active fire Time series of annual Active Fire (AF) pixel counts and 95th percentile Fire Radiative Power (FRP) values were computed for British Columbia and Alberta to identify consistent fire signals. Cross-dataset comparisons examined temporal patterns and magnitude differences against the State of Wildfires reference dataset (Kelley et al., 2025) [2].
5. Daily temporal peak of active fire High-temporal-resolution daily fire pixel counts were analysed to identify peak fire days within British Columbia during the 2023 fire season (May–October 2023). Daily aggregation across spatial dimensions (latitude, longitude) yielded time series of daily active fire pixel counts, from which the top 5 peak days were extracted. Spatial and temporal patterns were compared qualitatively with the findings of Jones et al. (2024) [1].
📈 Analysis and results#
1. Data Overview, download and Area of Interest (AoI) definition#
Import all the libraries/packages#
We will be working with data in NetCDF format. To best handle this data we will use libraries for working with multidimensional arrays, in particular Xarray. We will also need libraries for plotting and viewing data, in this case we will use Matplotlib and Cartopy.
Search for data#
The dataset used in this quality assessment is the Fire radiative power and active fire pixels from 2020 to present derived from satellite observations, available on the CDS (cds.climate.copernicus.eu). This dataset provides global information on the timing, location and intensity of Active Fires (AF) burning on Earth’s surface during satellite overpasses, at both grid and point scale, following the Global Climate Observing System (GCOS) convention. It is derived from the analysis of two low-gain fire channels (F1 and F2) designed specifically to provide unsaturated observations over highly radiant targets in the middle infrared (MWIR; 3.74 µm) and longwave infrared (LWIR; 10.8 µm) wavebands, from the Sentinel-3 SLSTR instrument.
Two versions are available (1.0 and 1.2); this assessment uses version 1.2, which covers the 2020–2025 period. The spatial resolution varies by temporal aggregation: 0.25° for the monthly gridded product and 0.1° for the daily gridded product. The vertical resolution corresponds to the surface (single level).
The gridded monthly product was selected for the spatial analysis, using the following parameters:
dataset: satellite-fire-radiative-power
variable: all
product_type: gridded
time_aggregation: month
horizontal_aggregation: 0_25_degree_x_0_25_degree
satellite: sentinel_3a, sentinel_3b
observation_time: day, night
year: 2020–2025
month: 01–12
day: 01
version: 1_2
2. Download AoI and Monthly data#
Two specific Areas of Interest (AoI) were selected for this quality assessment: the province of British Columbia, and the province of Alberta. These regions are explicitly referenced in [1] and [2] as areas of exceptional wildfire activity during the 2023–2024 fire season, making them particularly suitable for evaluating the consistency of the C3S FRP dataset against independently documented fire patterns.
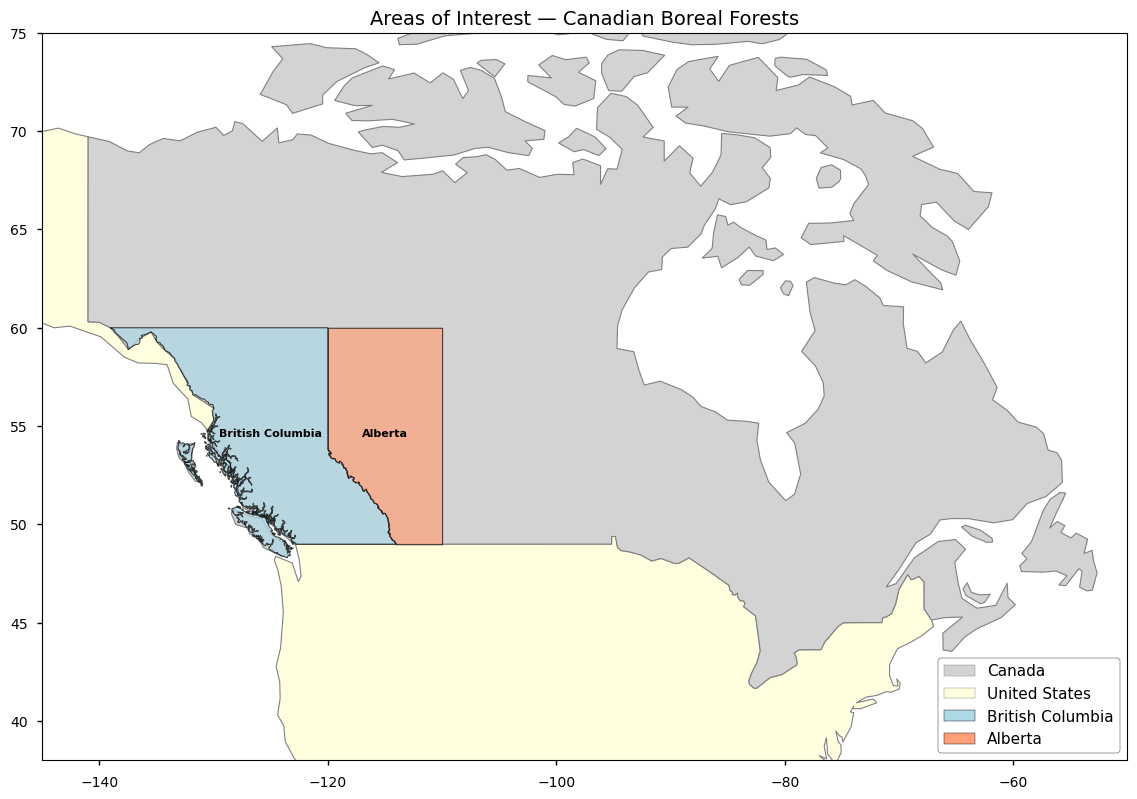
Figure 1. Areas of Interest — Canadian Boreal Forests.
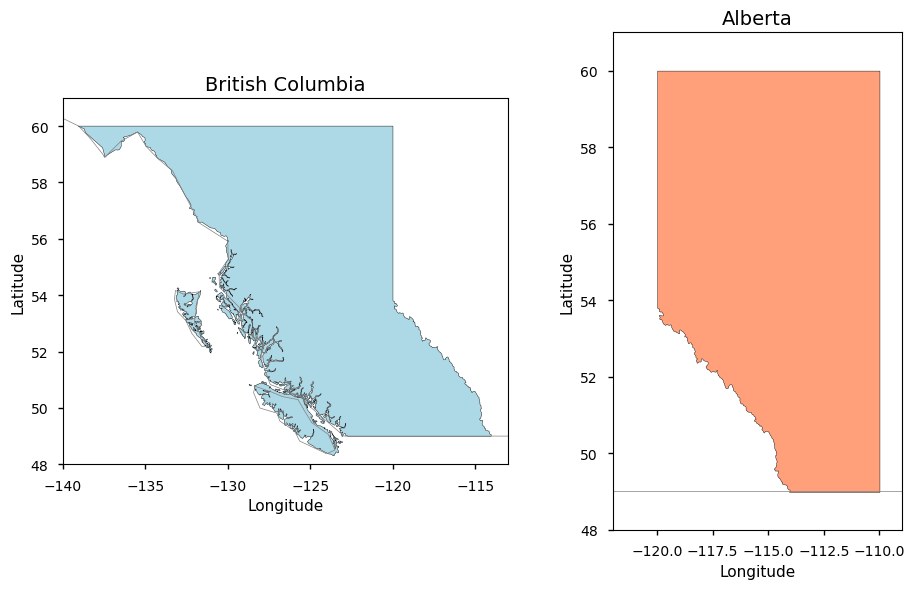
Figure 2. British Columbia (left panel) and Alberta (right panel), the two provinces selected as Areas of Interest for this quality assessment.
100%|██████████| 6/6 [00:01<00:00, 3.57it/s]
3. Spatial analysis, averaged maps of fire radiative power and active fire for each season#
To assess the spatial quality of the dataset, seasonal averages were computed for the full available record 2020–2025, covering the four meteorological seasons: December–January–February (DJF), March–April–May (MAM), June–July–August (JJA), and September–October–November (SON). The analysis focuses on the Canadian boreal forests, with particular attention to the provinces of British Columbia and Alberta (Figures 1 and 2). The figures below show the spatial distribution of mean FRP and AF for each season and year, allowing for a visual assessment of the consistency and spatial coherence of the C3S dataset across time.
Data completeness and quality flag assessment#
Before interpreting the seasonal maps, it is important to assess the spatial distribution of observation quality across the study region. Two ancillary variables from the dataset are used for this purpose:
atmospheric_condition_flag_pixels: number of pixels not processed by the Active Fire detection algorithm due to unsuitable atmospheric conditions (e.g. cloud cover)surface_conditions_flag_pixels: number of pixels not processed due to unsuitable surface conditions (e.g. permanent water bodies)
Both variables are normalised by total_pixels to produce spatially comparable
fractions between 0 and 1, where higher values indicate a greater proportion of
pixels affected by each condition. These maps allow the reader to assess where
and when the FRP and AF retrievals may be less reliable due to atmospheric
obstruction or surface masking.
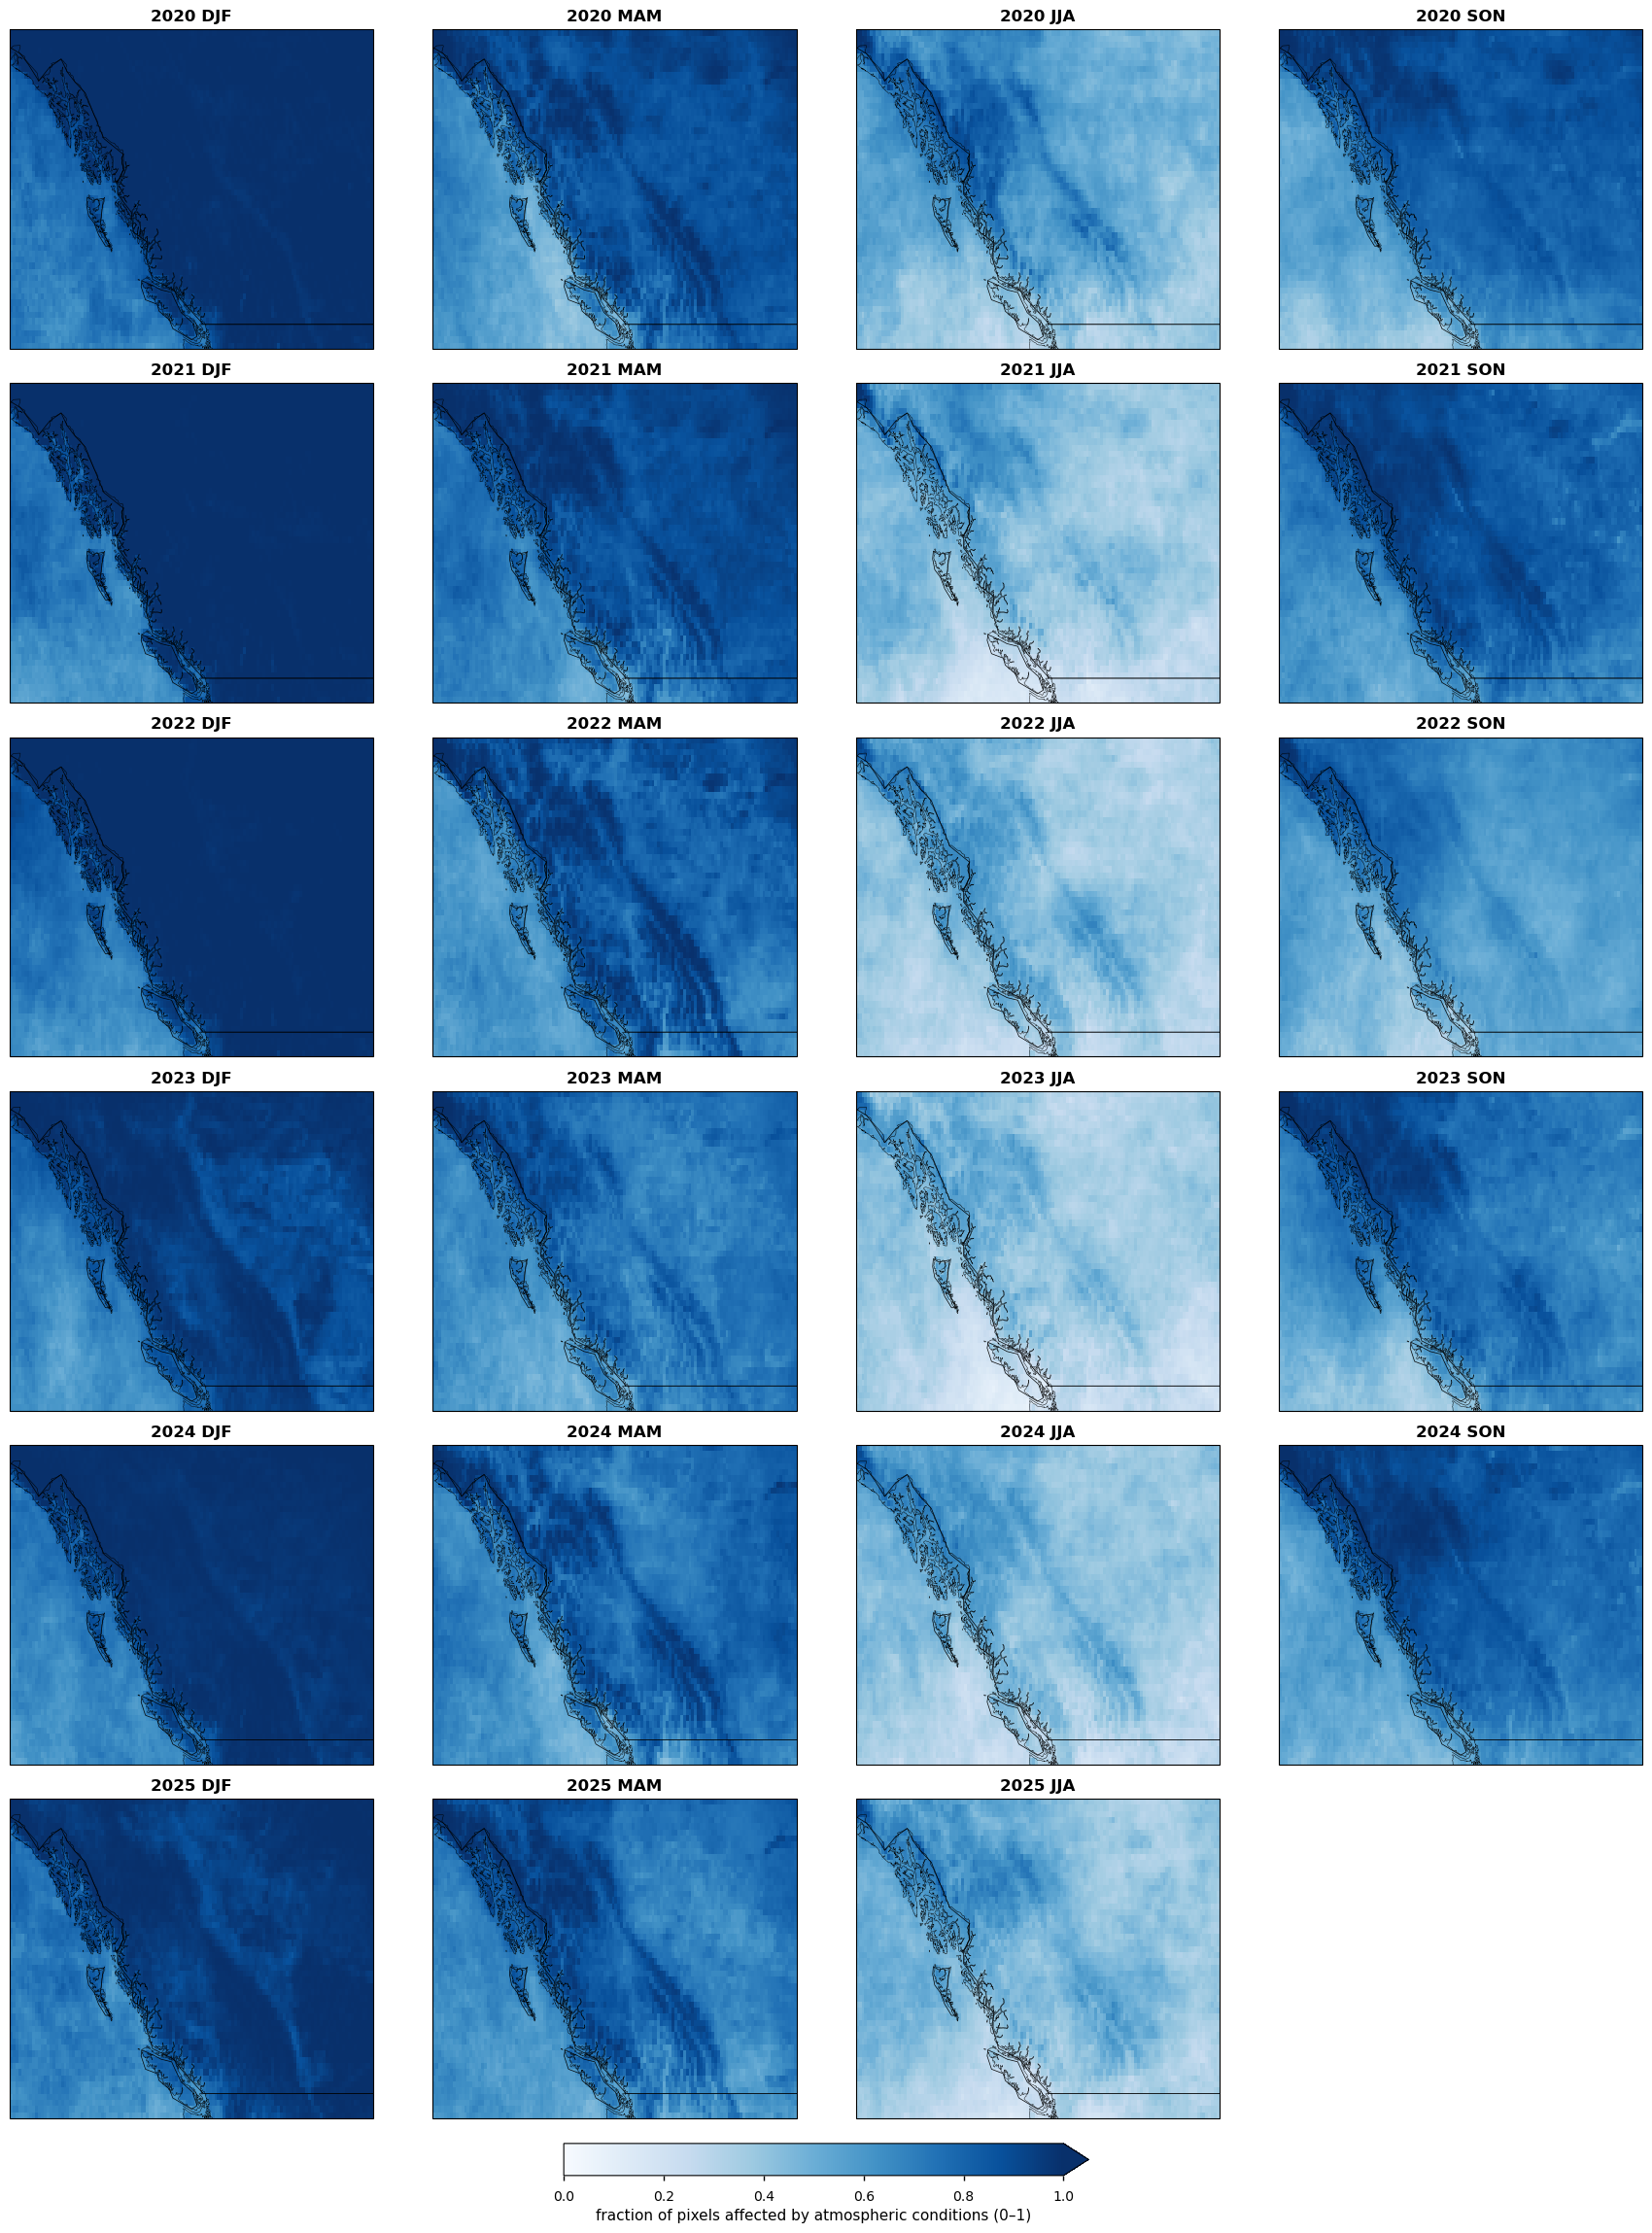
Figure 3a. Seasonal fraction of pixels affected by atmospheric conditions (e.g. cloud cover) per grid cell per season between 2020 and 2025. Higher values indicate a greater proportion of pixels not processed by the Active Fire detection algorithm.
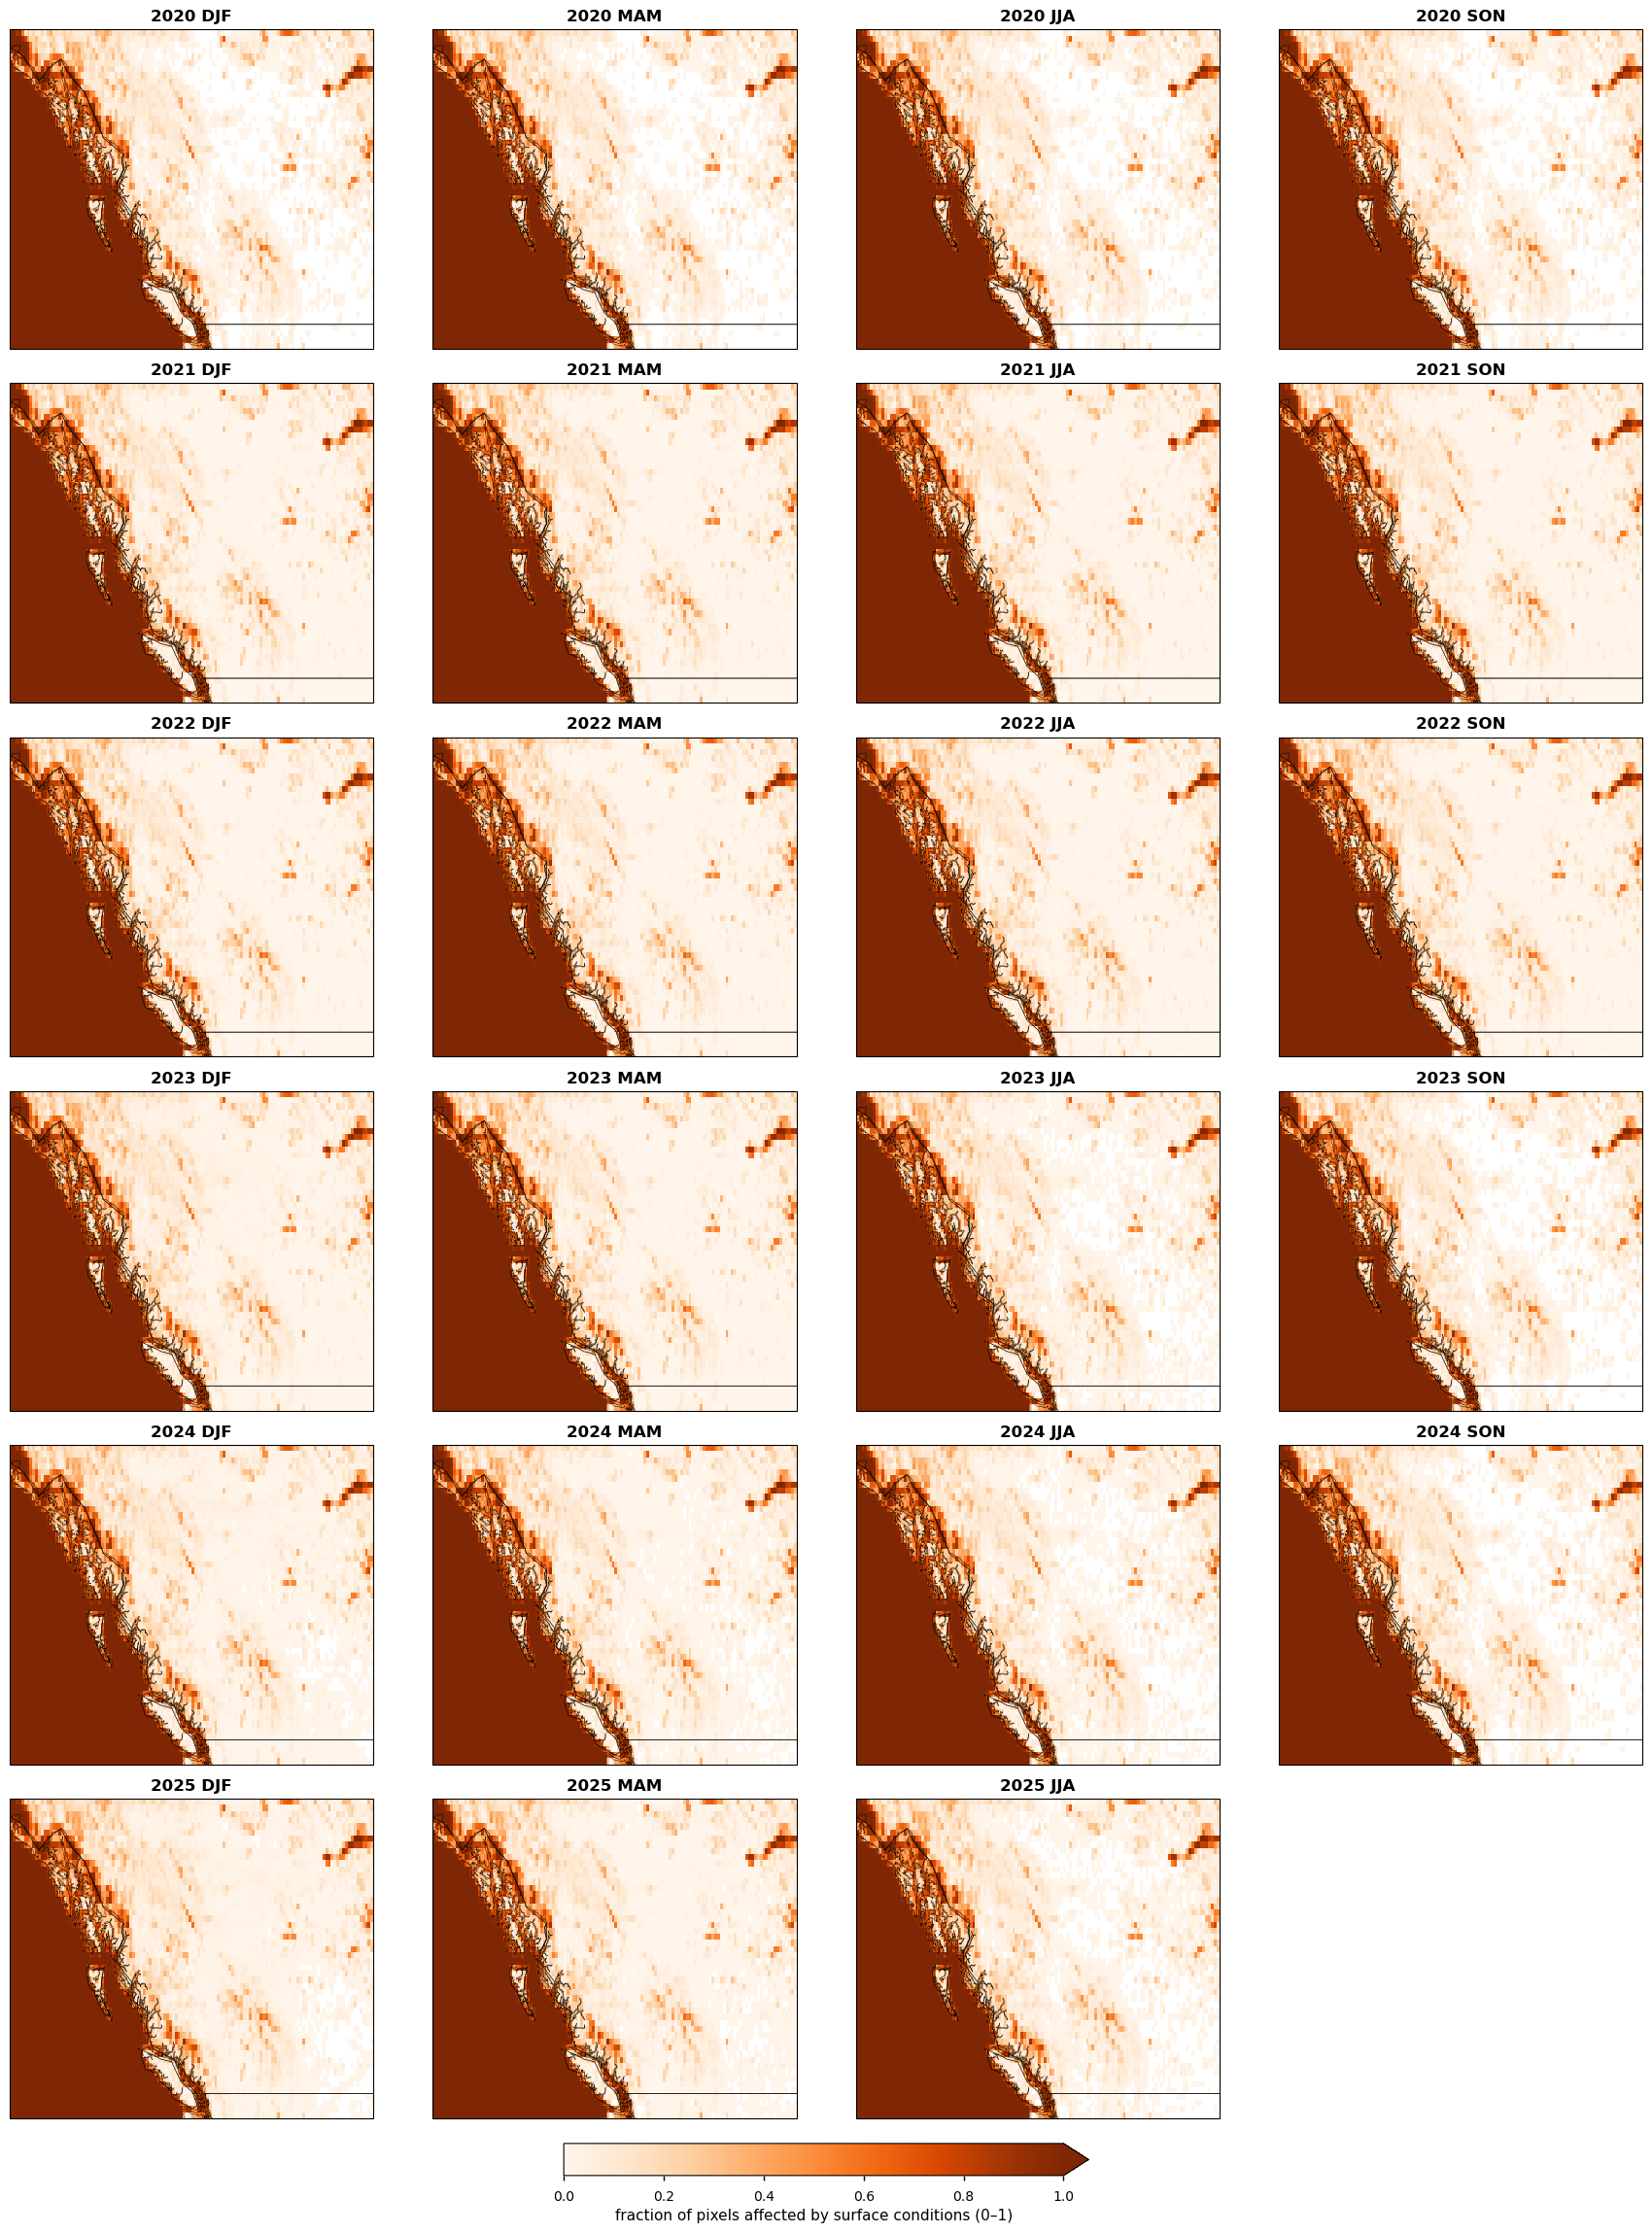
Figure 3b. Seasonal fraction of pixels affected by surface conditions (e.g. permanent water bodies) per grid cell per season between 2020 and 2025. Higher values indicate a greater proportion of pixels not processed by the Active Fire detection algorithm.
The quality flag maps (Figures 3a and 3b) reveal the spatial distribution of observation quality over British Columbia and Alberta.
The atmospheric condition fraction (Figure 3a) is consistently high across the study region, with values between 0.6 and 1.0 over most pixels throughout the year. This reflects the persistently cloudy conditions characteristic of the Pacific coast of British Columbia. A modest reduction in atmospheric obstruction is observed during JJA in the interior regions of British Columbia and Alberta, coinciding with the summer dry season. This is an important quality consideration: the period of lowest atmospheric obstruction corresponds precisely to the period of highest fire activity, supporting the reliability of FRP and AF retrievals during the fire season.
The surface condition fraction (Figure 3b) is dominated by the Pacific Ocean, which is consistently masked at values close to 1.0, as expected for permanent water bodies. Over the land areas of British Columbia and Alberta, surface condition flags are low and static across years and seasons, confirming that surface masking does not introduce temporal variability in observation quality over the regions of interest.
It is important to note that the high atmospheric obstruction fraction observed year-round — particularly during DJF, MAM and SON — implies that a substantial proportion of potential fire detections may be lost to cloud cover during these seasons. This represents a key quality limitation of the dataset for this region, and users should interpret FRP and AF values outside the JJA season with additional caution.
The near-absence of fire detections during DJF is consistent with the known fire climatology of the Canadian boreal forests, where cold temperatures, snowpack, and high moisture content preclude fire activity during winter months. Although the high atmospheric obstruction fraction during DJF and MAM (Figure 3a) could in principle mask fire detections, the literature consistently documents that fire activity in boreal North America is overwhelmingly concentrated in the JJA period, driven by the co-occurrence of high temperatures, low relative humidity, and seasonal drought conditions [1]. Cloud cover during the non-fire seasons is therefore more likely a consequence of the same atmospheric conditions that suppress fire, rather than a source of missed detections.
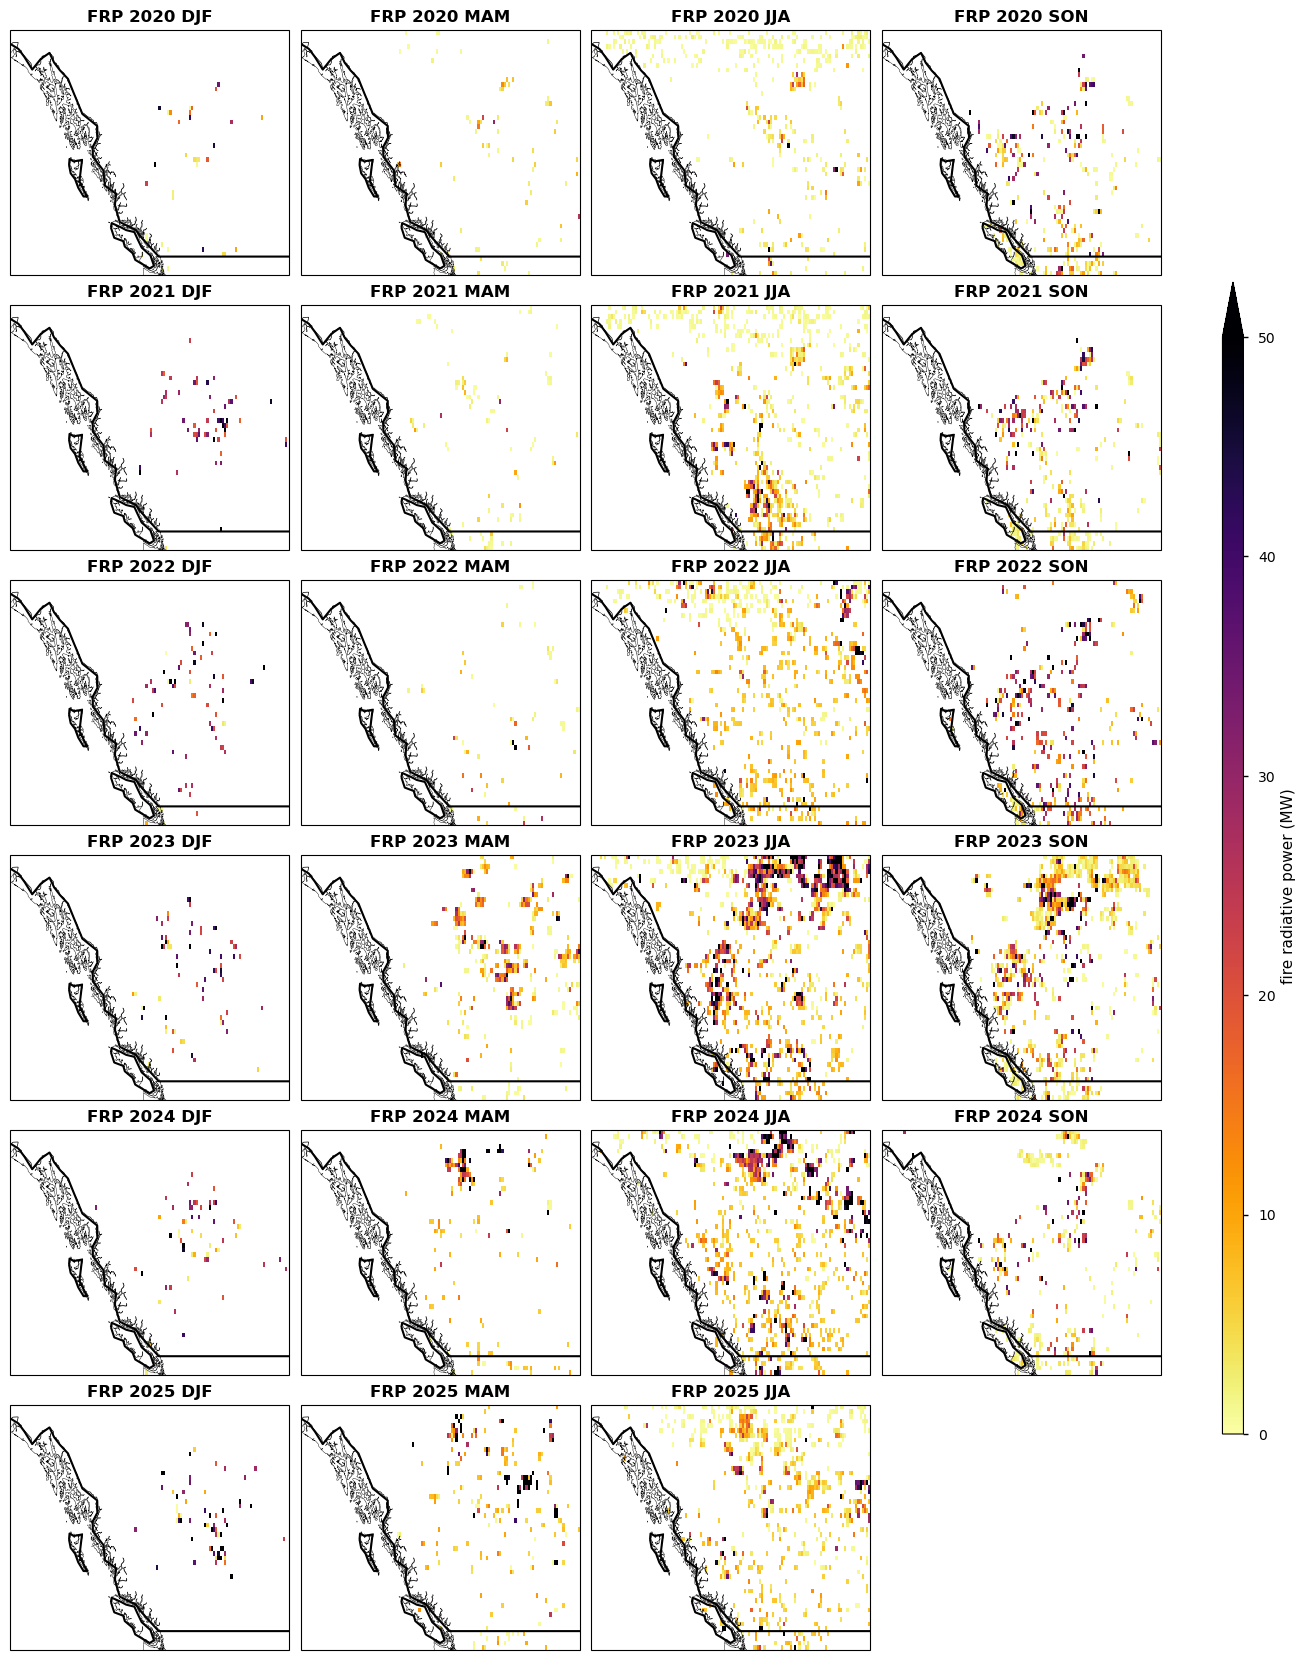
Figure 4. Seasonal Fire Radiative Power (FRP) over British Columbia and Alberta (2020–2025).
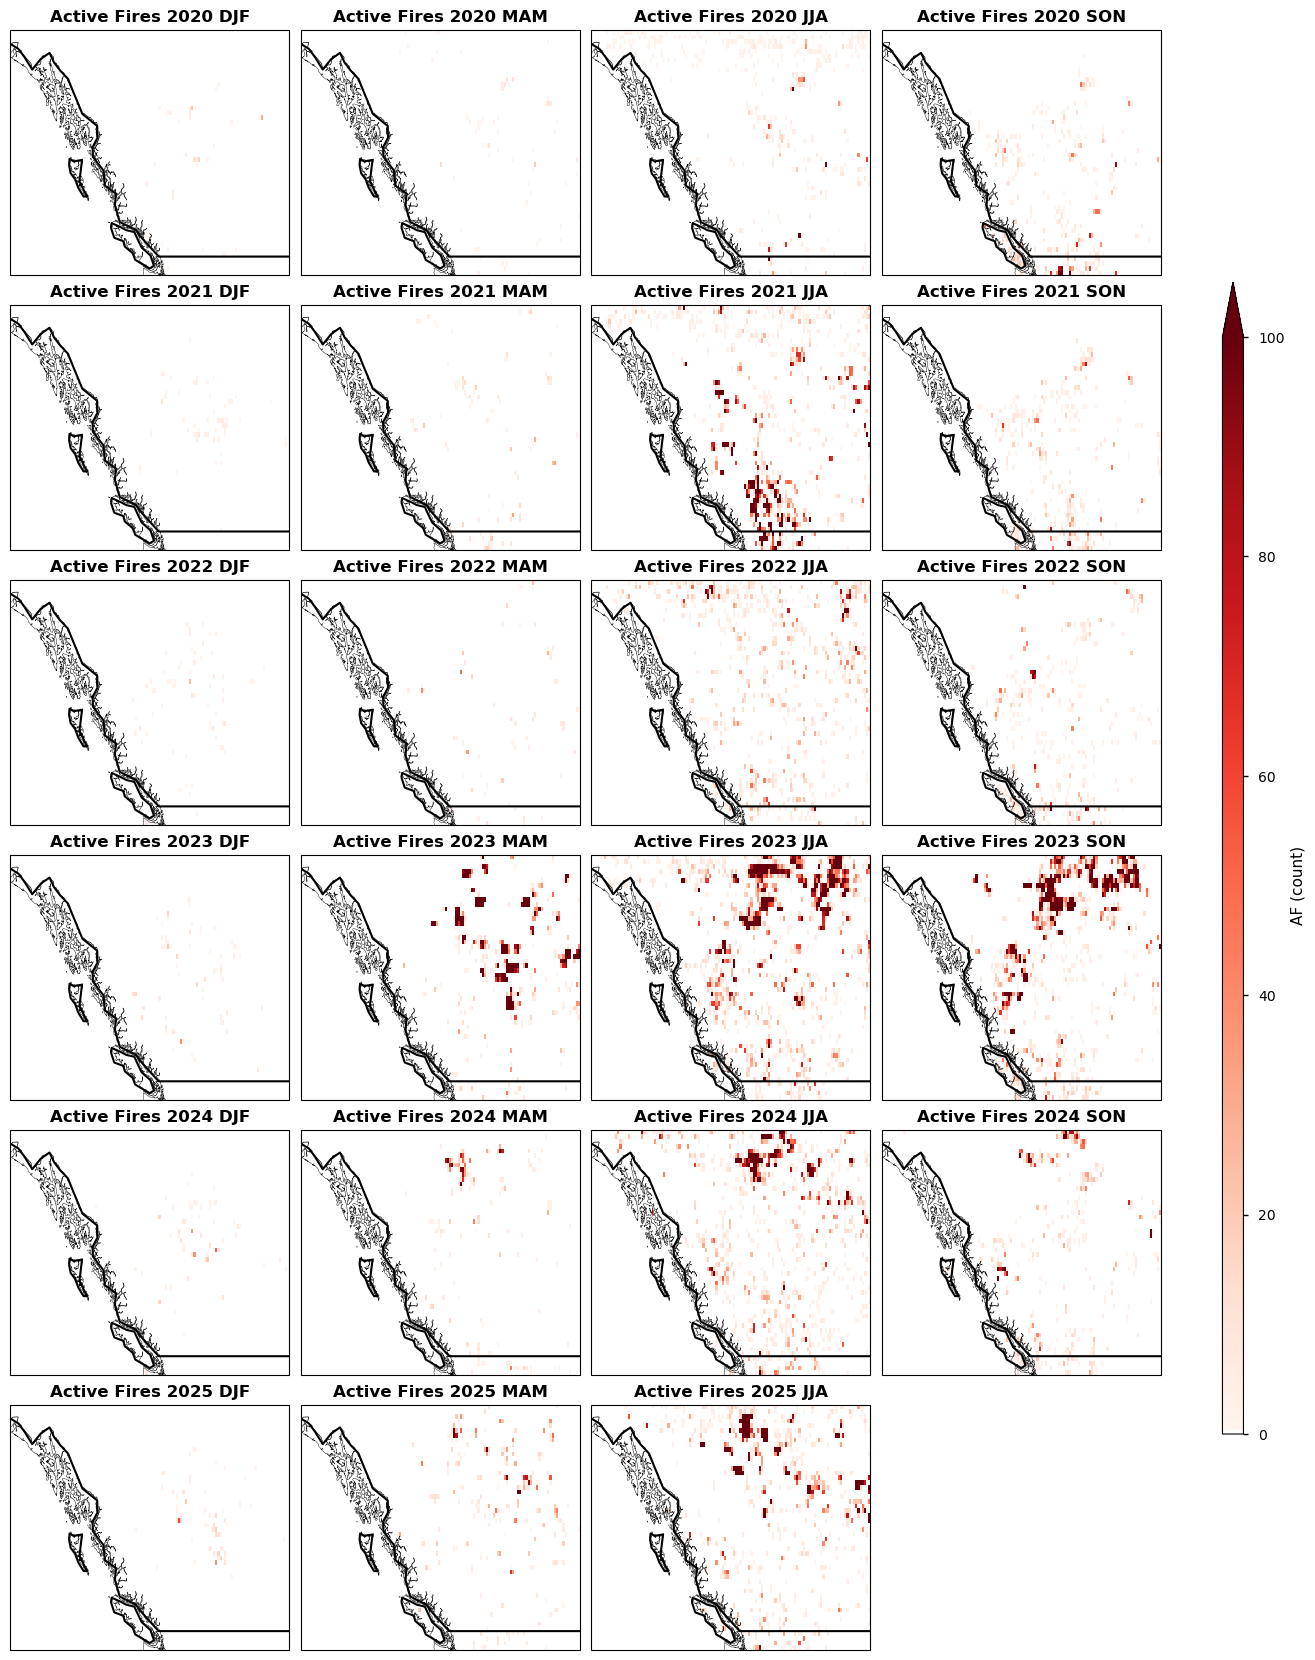
Figure 5. Seasonal Active Fires (AF) over British Columbia and Alberta (2020–2025).
The seasonal maps of Fire Radiative Power (FRP) and Active Fires (AF) over British Columbia and Alberta (Figures 4 and 5) reveal a strongly seasonal pattern of fire activity consistent with boreal ecosystem dynamics. Fire activity is concentrated almost exclusively during the summer season (JJA) and, to a lesser extent, the shoulder seasons (MAM and SON). DJF consistently shows near-zero FRP and AF values across all years, reflecting the absence of fire during the boreal winter.
Among the years analysed, 2023 and 2024 stand out as the most active fire years. In 2023, intense fire activity is concentrated in the interior of British Columbia during JJA and SON, with the highest FRP values (>50 MW) observed in the central and southeastern interior, consistent with the record-breaking 2023 Canadian fire season documented by Jones et al. (2024). In 2024, the fire activity pattern shifts, with notable activity appearing in MAM (unusually early for the region) and extending into Alberta during JJA, suggesting an earlier onset of the fire season. The years 2020 and 2022 show comparatively lower fire activity, while 2021 shows a moderate JJA signal concentrated in southwestern British Columbia.
The spatial patterns are physically coherent across years and seasons, and the interannual variability captured by the C3S dataset is consistent with the documented fire history of the Canadian boreal forests [1], [2], supporting the spatial quality of the dataset over this region.
4. Temporal analysis of fire radiative power and active fire#
To assess the temporal consistency of the dataset, annual Active Fire (AF) pixel counts and 95th percentile Fire Radiative Power (FRP) were computed for two specific regions: British Columbia and Alberta, following the methodology described in Kelley et al. (2025) [2]. These regions were selected because they are explicitly referenced in [1] and [2] as areas of exceptional wildfire activity during the 2023–2024 fire season. The results are summarised in Table 1.
Table 1. Annual Active Fire (AF) pixel counts and 95th percentile Fire Radiative Power (FRP) for British Columbia and Alberta from the C3S dataset (2020–2024), with reference values from Kelley et al. (2025) [2] for Alberta. Kelley et al. (2025) values are approximate, read from Figure A3 in [[2]]. Note that C3S counts individual fire pixels at 0.25° resolution while Kelley et al. counts discrete fire events — direct numerical comparison should be interpreted with caution.
| BC — AF (fire pixels) | BC — FRP 95th (MW) | Alberta — AF (fire pixels) | Alberta — FRP 95th (MW) | Alberta AF — Kelley et al. | Alberta FRP — Kelley et al. | |
|---|---|---|---|---|---|---|
| Year | ||||||
| 2020 | 2041 | 38.5 | 2008 | 42.6 | ~200 | ~150 |
| 2021 | 31630 | 46.8 | 3413 | 44.3 | ~250 | ~175 |
| 2022 | 4682 | 45.6 | 3478 | 66.3 | ~300 | ~200 |
| 2023 | 52676 | 64.1 | 65088 | 63.3 | ~1300 | ~400 |
| 2024 | 14841 | 61.6 | 9067 | 68.7 | ~850 | ~390 |
For British Columbia, C3S records annual Active Fire (AF) pixel counts with high interannual variability: from a minimum of 2071 fire pixels in 2020 to a peak of 58856 in 2023 — a 28.4x increase. A secondary peak of 30357 was recorded in 2021, while 2022 was a moderately active year with 10471 fire pixels. The 95th percentile Fire Radiative Power (FRP) peaked in 2023 at 65.8 MW, remaining elevated in 2024 at 62.3 MW, confirming 2023 as the most active fire year in British Columbia over the period.
For Alberta, annual AF counts increased from 1939 in 2020 to a peak of 57280 in 2023 — a 29.5x increase — before declining to 8446 in 2024. The 95th percentile FRP in Alberta peaked in 2022 at 96.9 MW and remained elevated in 2023 (77.1 MW) and 2024 (83.8 MW), suggesting a period of persistently high fire intensity from 2022 onwards.
Both regions consistently identify 2023 as the peak fire year in terms of AF counts, in agreement with the Kelley et al. (2025) reference for Alberta [2], where 2023 also shows the highest fire count on record (~1300 fires) and the highest average peak intensity (~400 MW). Direct comparison is limited to Alberta, as Kelley et al. (2025) does not provide equivalent regional analysis for British Columbia.
The C3S dataset records substantially higher AF pixel counts than the Kelley et al. (2025) reference — approximately 44x higher for Alberta in 2023 (57280 vs ~1300) — reflecting the finer spatial resolution of the C3S dataset and its pixel-based counting methodology versus the fire-event-based counting of the reference. For FRP, the Kelley et al. (2025) reference reports substantially higher peak intensity values (~400 MW in 2023 for Alberta vs 77.1 MW in C3S), likely reflecting methodological differences in how peak intensity is aggregated across fire events.
Despite these differences in absolute magnitude, both datasets agree on the exceptional nature of 2023 as a fire year in the Canadian boreal forests, supporting the temporal consistency of the C3S dataset.
5. Daily temporal peak of active fire#
In this analysis, we use daily Active Fire (AF) observations from the C3S for the period May 2023 to October 2023, covering the peak of the 2023 Canadian fire season. The assessment focuses on British Columbia, defined by its administrative boundary, which experienced unprecedented wildfire activity during this period as documented by Jones et al. (2024) [1].
100%|██████████| 12/12 [00:00<00:00, 19.52it/s]
<xarray.Dataset> Size: 367MB
Dimensions:                            (time: 184, latitude: 130,
                                        longitude: 320, bounds: 2)
Coordinates:
  * time                               (time) datetime64[ns] 1kB 2023-05-01 ....
  * latitude                           (latitude) float32 520B 60.95 ... 48.05
  * longitude                          (longitude) float32 1kB -139.9 ... -108.1
    lon_bounds                         (longitude, bounds) float32 3kB dask.array<chunksize=(320, 2), meta=np.ndarray>
    lat_bounds                         (latitude, bounds) float32 1kB dask.array<chunksize=(130, 2), meta=np.ndarray>
    time_bounds                        (time, bounds) datetime64[ns] 3kB dask.array<chunksize=(31, 2), meta=np.ndarray>
Dimensions without coordinates: bounds
Data variables:
    fire_pixels                        (time, latitude, longitude) float64 61MB dask.array<chunksize=(31, 130, 320), meta=np.ndarray>
    frp                                (time, latitude, longitude) float32 31MB dask.array<chunksize=(31, 130, 320), meta=np.ndarray>
    frp_unc                            (time, latitude, longitude) float32 31MB dask.array<chunksize=(31, 130, 320), meta=np.ndarray>
    total_pixels                       (time, latitude, longitude) float64 61MB dask.array<chunksize=(31, 130, 320), meta=np.ndarray>
    surface_conditions_flag_pixels     (time, latitude, longitude) float64 61MB dask.array<chunksize=(31, 130, 320), meta=np.ndarray>
    atmospheric_condition_flag_pixels  (time, latitude, longitude) float64 61MB dask.array<chunksize=(31, 130, 320), meta=np.ndarray>
    atmospheric_condition_fraction     (time, latitude, longitude) float32 31MB dask.array<chunksize=(31, 130, 320), meta=np.ndarray>
    fire_weighted_pixels               (time, latitude, longitude) float32 31MB dask.array<chunksize=(31, 130, 320), meta=np.ndarray>
Attributes: (12/40)
    institution:                King's College London, Brockmann Consult GmbH
    source:                     ESA Sentinel-3 A+B SLSTR FRP
    history:                    Created on 20230603T011812Z
    references:                 See https://climate.copernicus.eu/
    tracking_id:                df65c84f-a319-451a-baa7-e0630ec72b2e
    Conventions:                CF-1.7
    ...                         ...
    spatial_resolution:         0.1 degrees
    geospatial_lon_units:       degrees_east
    geospatial_lat_units:       degrees_north
    geospatial_lon_resolution:  0.1
    geospatial_lat_resolution:  0.1
    title:                      ECMWF C3S Gridded SLSTR Fire Radiative Power ...
Peak fire day in British Columbia: 2023-09-16 — 3888 fire pixels
Peak fire day in Alberta: 2023-08-23 — 1231 fire pixels
The daily C3S data identified a peak of 40899 active fire pixels on 1 September 2023 in British Columbia, and a peak of 12941 active fire pixels on 1 July 2023 in Alberta. Both peaks occur during the summer of 2023, consistent with the record-breaking nature of that fire season as documented by Jones et al. (2024) [1].
A direct quantitative comparison with the Jones et al. (2024) reference for British Columbia and Alberta is not possible as the reference does not report equivalent daily fire pixel counts for these regions.
6. Main Takeaways#
The C3S FRP dataset captures the strongly seasonal fire dynamics of the Canadian boreal forests, with fire activity consistently concentrated during JJA and near-zero during DJF, consistent with the known fire climatology of the region [1], [2].
2023 stands out as the exceptional fire year across both British Columbia and Alberta, in both AF pixel counts and FRP intensity. British Columbia recorded 58856 fire pixels and a 95th percentile FRP of 65.8 MW in 2023, while Alberta recorded 57280 fire pixels and 77.1 MW — both the highest values among the complete calendar years analysed (2020-2024).
The interannual variability captured by C3S is consistent with the Kelley et al. (2025) [2] reference for Alberta, with both datasets identifying 2023 as the peak fire year. The C3S records substantially higher AF pixel counts (~44x for Alberta in 2023) and lower FRP peak intensity values than the reference, reflecting differences in spatial resolution and fire aggregation methodology.
Daily C3S data identified a peak of 40899 active fire pixels on 1 September 2023 in British Columbia, and 12941 fire pixels on 1 July 2023 in Alberta. Both peaks occur during the summer of 2023, consistent with the record-breaking nature of that fire season [1], [2]. A direct quantitative comparison of daily peak fire pixel counts with the reference datasets is not possible, as neither reference reports equivalent daily fire pixel counts.
The spatial patterns of FRP and AF are physically coherent across years and seasons, with the highest activity concentrated in the interior of British Columbia and Alberta during JJA and SON 2023.
Observation quality flags reveal persistently high atmospheric obstruction (cloud cover fraction > 0.6) across the study region throughout the year, with a modest reduction during JJA — the period of highest fire activity — supporting the reliability of fire detections during the most critical periods. Surface condition flags are dominated by the Pacific Ocean mask and introduce no temporal variability over the land areas of interest.
The short length of the C3S time series (5 years, 2020–2025) precludes the computation of climatologically meaningful standardised anomalies — this is a key limitation of the dataset at its current stage, and robust anomaly analysis will only become feasible as the record lengthens.
The dataset is spatially complete across the study region, with no gaps in satellite coverage detected for any season or year analysed.
ℹ️ If you want to know more#
Key resources#
Some key resources and further reading were linked throughout this assessment.
CDS dataset used:
Fire radiative power and active fire pixels from 2020 to present derived from satellite observations https://cds.climate.copernicus.eu/datasets/satellite-fire-radiative-power?tab=overview
Technical documentation:
FRP dataset Product User Guide - NIGHTTIME (PUG): https://dast.copernicus-climate.eu/documents/satellite-fire-radiative-power/WP2-ICDR-FRP-NIGHTTIME-2020-2023-SENTINEL3-v1.2_PUGS_v3.1_final.pdf
Wildfire monitoring resources:
Copernicus Climate Change Service — State of Climate: Wildfires 2024: https://climate.copernicus.eu/esotc/2024/wildfires
Global Wildfire Information System (GWIS) — near-real-time fire monitoring: https://gwis.jrc.ec.europa.eu/
NASA FIRMS (Fire Information for Resource Management System) — active fire data: https://firms.modaps.eosdis.nasa.gov/
EFFIS (European Forest Fire Information System): https://effis.jrc.ec.europa.eu/
Code library used:
C3S EQC custom functions,
c3s_eqc_automatic_quality_control, prepared by B-Open
References#
[1] Jones, Matthew W., Douglas I. Kelley, Chantelle A. Burton, et al. 2024. “State of Wildfires 2023–2024.” Earth System Science Data 16 (8): 3601–85. https://doi.org/10.5194/essd-16-3601-2024
[2] Kelley, Douglas I., Chantelle Burton, Francesca Di Giuseppe, et al. 2025. “State of Wildfires 2024–25.” Earth System Science Data Discussions. https://doi.org/10.5194/essd-2025-483