Explore glacier_area#
Initialize Python environment#
# Import standard libraries
import zipfile

# # Import third party libraries
import cartopy.crs
import cdsapi
import matplotlib.pyplot
import numpy as np
import xarray

# Ignore distracting warnings
import warnings
warnings.filterwarnings('ignore')
Download data#
We will use the Climate Data Store (CDS) API to download the glacier extent dataset from the Randolph Glacier Inventory for the year 2000.
NOTE: To use the CDS API, you first need to register (if not already), accept the dataset terms, find your UID and API key on your acount page, and fill them in below.
# Fill in your UID and API key (separated by a colon :)
KEY = 'UID:API Key'

c = cdsapi.Client(key=KEY)
c.retrieve(
    name='insitu-glaciers-extent',
    request={
        'variable': 'glacier_area',
        'version': '6_0',
        'format': 'zip',
        'product_type': 'gridded',
    },
    target='glacier_area-gridded.zip'
)
2024-02-19 14:08:46,910 INFO Welcome to the CDS
2024-02-19 14:08:46,910 INFO Sending request to https://cds.climate.copernicus.eu/api/v2/resources/insitu-glaciers-extent
2024-02-19 14:08:47,094 INFO Request is completed
2024-02-19 14:08:47,098 INFO Downloading https://download-0010-clone.copernicus-climate.eu/cache-compute-0010/cache/data3/dataset-insitu-glaciers-extent-23301c0f-713d-44b1-8f27-81b395bcc5f5.zip to glacier_area-gridded.zip (15.5K)
2024-02-19 14:08:47,399 INFO Download rate 52.5K/s
Result(content_length=15828,content_type=application/zip,location=https://download-0010-clone.copernicus-climate.eu/cache-compute-0010/cache/data3/dataset-insitu-glaciers-extent-23301c0f-713d-44b1-8f27-81b395bcc5f5.zip)
Since the data is downloaded as a zip file, we have to first unzip it.
with zipfile.ZipFile('glacier_area-gridded.zip', 'r') as file:
    file.extractall('glacier_area')
Read and inspect data#
The data are formatted as a single netCDF4 file, which can be read using xarray.
ds = xarray.open_dataset('glacier_area/rgi6_gridded.nc')
ds
<xarray.Dataset>
Dimensions:       (lon: 360, lat: 170)
Coordinates:
  * lon           (lon) float64 -179.5 -178.5 -177.5 ... 177.5 178.5 179.5
  * lat           (lat) float64 84.5 83.5 82.5 81.5 ... -81.5 -82.5 -83.5 -84.5
Data variables:
    Glacier_area  (lat, lon) float32 ...
Attributes: (12/15)
    Source_Software:            Esri ArcGIS
    NCO:                        netCDF Operators version 4.9.1 (Homepage = ht...
    title:                      Randolph Glacier Inventory v6 (RGI6) gridded ...
    project:                    Copernicus Climate Change Service (C3S) Essen...
    data_version:               version 6.0
    institution:                Department of Geography - University of Zuric...
    ...                         ...
    geospatial_lon_resolution:  1.0
    geospatial_lat_resolution:  1.0
    references:                 Pfeffer et al. (2014) doi.org/10.3189/2014JoG...
    citation:                   RGI Consortium (2017): Randolph Glacier Inven...
    Conventions:                CF Version CF-1.0
comment: Brief data description: Temporal resolution: ...Glacier area is expressed as the percent area (0–100) of each 1° x 1° grid cell, so we will need the total area of each grid cell. We can estimate this using the following spherical formula:
\((\sin(\max \mathrm{latitude}) - \sin(\min \mathrm{latitude})) * (\max \mathrm{longitude} - \min \mathrm{longitude}) * R_e^2\)
where \(R_e\) is the Earth’s authalic radius (6371.0072 km) and the mininum and maximum latitude and longitude of the cell are in radians.
CELL_SIZE = 1  # degrees
AUTHALIC_EARTH_RADIUS = 6371.0072  # kilometers
# Build grids of the longitude and latitude of (the center of) each grid cell
longitude, latitude = np.meshgrid(ds['lon'], ds['lat'])
# Compute the area of each grid cell
cell_area = (
  np.sin(np.radians(latitude + CELL_SIZE / 2)) -
  np.sin(np.radians(latitude - CELL_SIZE / 2))
) * (
  np.radians(longitude + CELL_SIZE / 2) -
  np.radians(longitude - CELL_SIZE / 2)
) * AUTHALIC_EARTH_RADIUS ** 2
ds['cell_area'] = (('lat', 'lon'), cell_area)
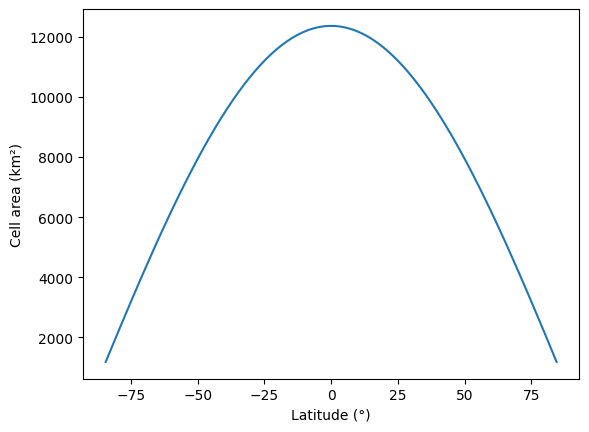
The cell area varies with latitude, from a minimum of 1 185 km² near the poles to a maximum of 12 364 km² at the equator.
matplotlib.pyplot.plot(ds['lat'], ds['cell_area'][:, 0])
matplotlib.pyplot.xlabel('Latitude (°)')
matplotlib.pyplot.ylabel('Cell area (km²)')
matplotlib.pyplot.show()
Finally, we can calculate the glacier area in each grid cell (glacier_area) by multiplying the provided percent area (Glacier_area) by the total area of the grid cell calculated above (cell_area).
ds['glacier_area'] = (1 / 100) * ds['Glacier_area'] * ds['cell_area']
Compute global glacier area#
Global glacier area (in km²) can be calculated by summing the glacier area of all cells (719 117 km²).
ds['glacier_area'].sum().data
array(719117.00710899)
We can also count the number of 1° x 1° grid cells that contain glaciers (2105).
ds['glacier_area'].notnull().sum().data
array(2105)
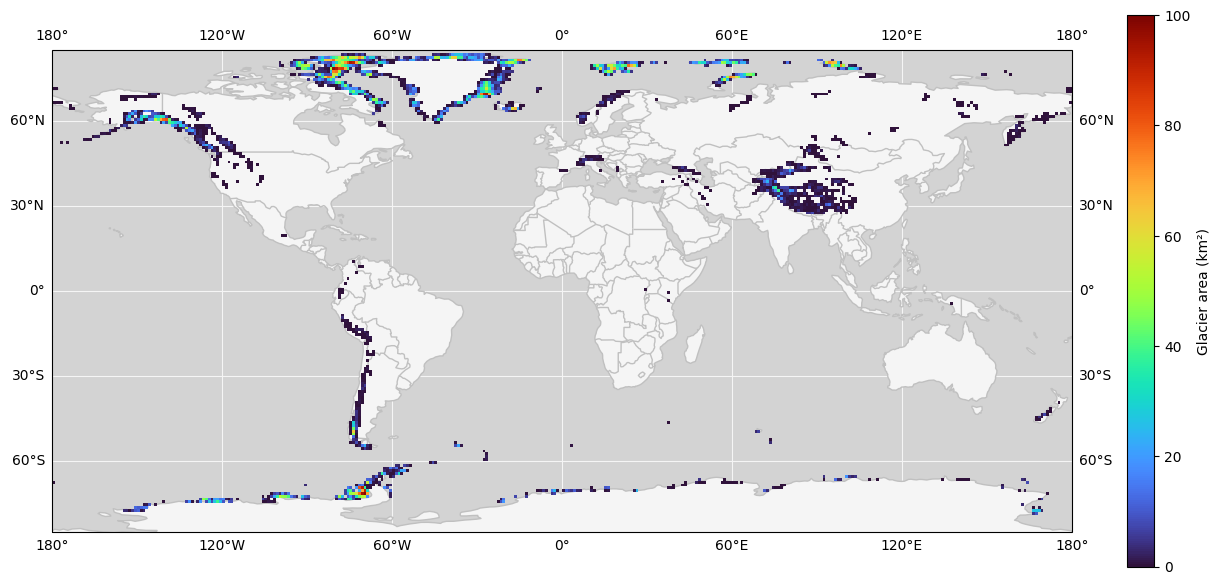
Plot glacier area percent on a map#
We use matplotlib and cartopy to make a global map of glacier percent area.
# Create a map with a plate carrée projection
figure = matplotlib.pyplot.figure(figsize=(12, 6))
axis = matplotlib.pyplot.axes(projection=cartopy.crs.PlateCarree())
axis.set_facecolor('lightgray')

# Add latitude, longitude gridlines
axis.gridlines(draw_labels=True, linestyle='-', color='whitesmoke', zorder=0)

# Add continents and country borders
axis.add_feature(cartopy.feature.LAND, edgecolor='silver', facecolor='whitesmoke', zorder=1)
axis.add_feature(cartopy.feature.BORDERS, edgecolor='silver', zorder=1)

# Plot glacier area
im = matplotlib.pyplot.pcolormesh(
  ds['lon'],
  ds['lat'],
  ds['Glacier_area'],
  cmap='turbo',
  vmin=0,
  vmax=100,
)

# Add a colorbar
cbar = matplotlib.pyplot.colorbar(im, fraction=0.025, label='Glacier area (%)')

# Show plot
figure.tight_layout(pad=0)
matplotlib.pyplot.show()