

8.2. Assessing global warming with the C3S Global Temperature Trend Monitor#
Production date: 2025-06-30.
Produced by: Olivier Burggraaff (National Physical Laboratory).
🌍 Use case: Monitoring global climate change through temperature trends#
❓ Quality assessment question#
Is the Global Temperature Trend Monitor application a suitable tool for calculating and visualising temperature trends?
Global warming, the steady increase in global average temperature over the past few decades [Shen+22, Mudelsee+19], is one of the most prominent aspects of climate change. More hot, dry days lead to a stronger personal perception of climate change among the general public [Marlon+21]. Accordingly, changes in global and regional temperature are widely reported on in both scientific [Copernicus Climate Change Service+24, IPCC+23] and popular media [Frijters+25, Poynting+25, Horton+24]. The Paris Agreement [United Nations+15] set a goal of limiting average global warming to well below 2 °C, ideally 1.5 °C. The actual rate of warming compared to this threshold is a crucial indicator of the progress of efforts to combat climate change.
In this assessment, the C3S Global Temperature Trend Monitor web application (Figure 8.2.1) is examined for its ability to calculate and display trends in global temperature. The uncertainty in the data and methods, and the ability of the application to display its uncertainty, are assessed.
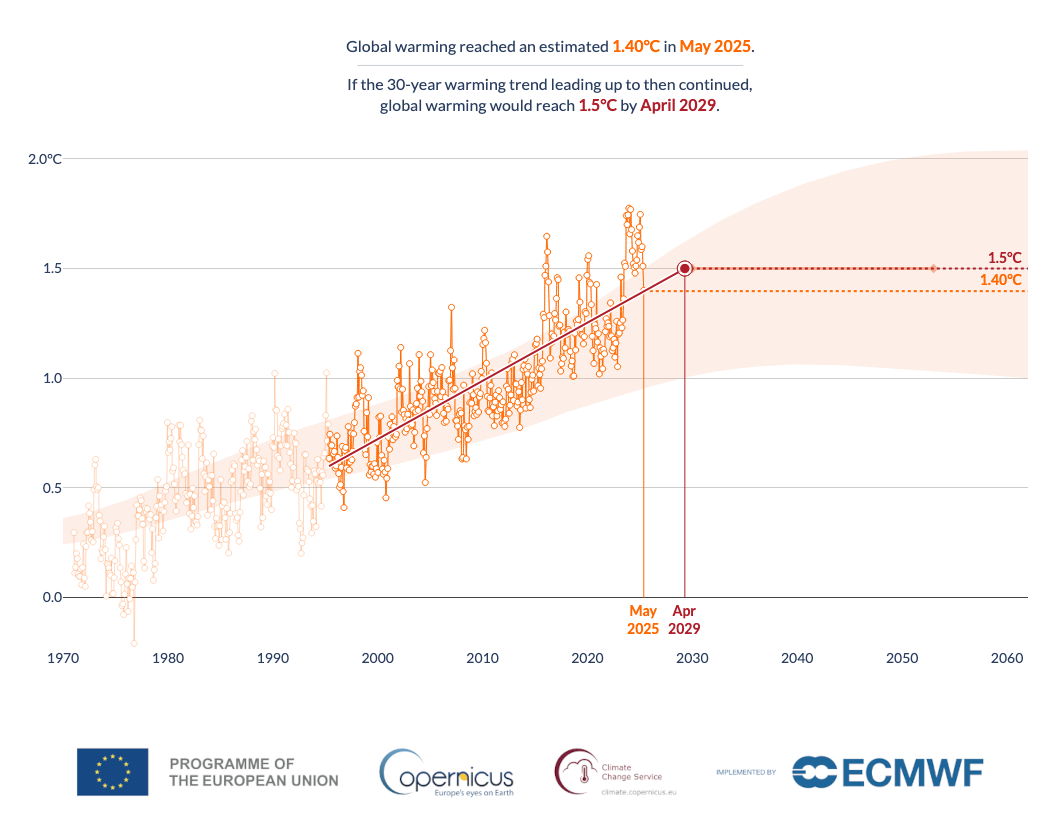
Fig. 8.2.1 The C3S Global Temperature Trend Monitor (GTTM) in May 2025. Orange dots show monthly global average temperature anomalies within (bright) and outside (faded) a user-specified 30-year window. A linear trend (red solid line) is fitted through the data and indicates the current average anomaly (orange dotted line; top text) and predicted time to reach 1.5 °C (red vertical line; top text), in this case April 2029. The orange envelope shows the IPCC climate projection uncertainty estimate.#
📢 Quality assessment statement#
These are the key outcomes of this assessment
The Global Temperature Trend Monitor (GTTM) is a scientifically sound tool for monitoring global temperature trends over decade-long time scales, and yearly changes therein.
The uncertainty associated with the methods used in GTTM (anomaly baselines, least squares fitting) is sufficiently small compared to the uncertainty in the underpinning dataset and inherent to the climate, and the application provides suitable methods for visualising the expected level of uncertainty.
The provided source code makes it possible to adapt GTTM to different user needs, e.g. regional rather than global trends, albeit with some additional considerations such as the calculation of anomalies relative to a local baseline.
📋 Methodology#
The C3S Global Temperature Trend Monitor (GTTM) is a C3S web application displaying monthly global average temperature anomalies. Temperatures from the ERA5 reanalysis [Hersbach+20] are compared to the pre-industrial (1850–1900) average to calculate temperature anomalies. A 30-year linear trend is fitted to these anomalies and extrapolated to estimate when global warming will reach 1.5 °C. The start and end of the 30-year range can be modified by the user to explore how the predicted date of reaching 1.5 °C has changed over time.
GTTM is based on two datasets:
ERA5 monthly averaged data on single levels from 1940 to present [ERA5 monthly dataset].
Essential climate variables for assessment of climate variability from 1979 to present [ECVs for climate variability dataset].
Applications are quality assessed separately from their underpinning datasets. For information on quality attributes of the underlying datasets, the reader is referred to the quality assessment of the datasets, which can be found in their respective CDS catalogue entries or on the EQC hub.
The analysis and results are organised in the following steps, which are detailed in the sections below:
📈 Analysis and results#
1. Underpinning dataset#
GTTM is based on ERA5 data, both directly through its monthly averaged data [ERA5 monthly dataset] and indirectly through a dataset of essential climate variables (ECVs) derived from ERA5, ERA5-Land, and ERA-Interim [ECVs for climate variability dataset]. Numerous validation studies have shown that ERA5 provides accurate and reliable estimates of surface air temperature, with strong agreement against in-situ measurements and other datasets, albeit with regional variations [Cavalleri+24, Liu+24, Yilmaz+23].
Uncertainties on individual ERA5 temperature data are typically 0.1–0.5 °C [Copernicus Climate Change Service+25a]. Some level of spatial and temporal covariance is to be expected, both physically and due to the methods of data production. While an exact value is difficult to provide, it can be fairly assumed that the uncertainty in global averages is smaller than that in individual data.
2. Temperature anomalies#
GTTM calculates monthly temperature anomalies by subtracting the 1991–2020 climatology (ECV dataset) from ERA5 monthly temperatures. In general, ERA5 temperature anomalies agree well with those from other sources [Hersbach+20].
The 1991–2020 baseline anomalies are converted to anomalies against the 1850–1900 pre-industrial average using a set of monthly offsets based on three datasets (Berkeley Earth, HadCRUT5, NOAAGlobalTemp; see table below) spanning 1850–2020. These monthly offsets were calculated as global averages: averaged first by grid square, then by hemisphere, then overall. This method is also used in the C3S Climate Bulletin and is explained in detail in [Copernicus Climate Change Service+25b].
Month |
Berkeley Earth |
HadCRUT5 |
NOAAGlobalTemp |
Average |
Applied Offset |
|---|---|---|---|---|---|
Jan |
0.99 |
0.97 |
0.83 |
0.93 |
0.96 |
Feb |
1.03 |
1.00 |
0.84 |
0.96 |
0.96 |
Mar |
1.04 |
1.03 |
0.87 |
0.98 |
0.95 |
Apr |
0.98 |
0.97 |
0.84 |
0.93 |
0.91 |
May |
0.90 |
0.88 |
0.76 |
0.85 |
0.87 |
Jun |
0.86 |
0.83 |
0.76 |
0.82 |
0.83 |
Jul |
0.81 |
0.77 |
0.71 |
0.77 |
0.80 |
Aug |
0.88 |
0.80 |
0.73 |
0.80 |
0.80 |
Sep |
0.93 |
0.80 |
0.76 |
0.83 |
0.81 |
Oct |
0.92 |
0.87 |
0.81 |
0.87 |
0.85 |
Nov |
0.95 |
0.97 |
0.82 |
0.92 |
0.89 |
Dec |
0.97 |
0.93 |
0.80 |
0.90 |
0.93 |
Annual Mean |
0.94 |
0.90 |
0.80 |
0.88 |
0.88 |
The applied offset differs from the three source datasets by –0.13 to +0.12 °C or –14% to +15% (Figure 8.2.2). This uncertainty in the baseline correction propagates into the anomalies used in GTTM on two scales:
Yearly: Since the same offset is applied to every year, there is an uncertainty in the overall offset of the data but not in year-on-year differences. This uncertainty affects the offset of the fitted line but not its slope.
Monthly: Seasonal differences in the offsets and in the uncertainties therein cause an uncertainty in the month-on-month differences within each year. Over multiple years, this averages out and should not significantly affect the fitted line.
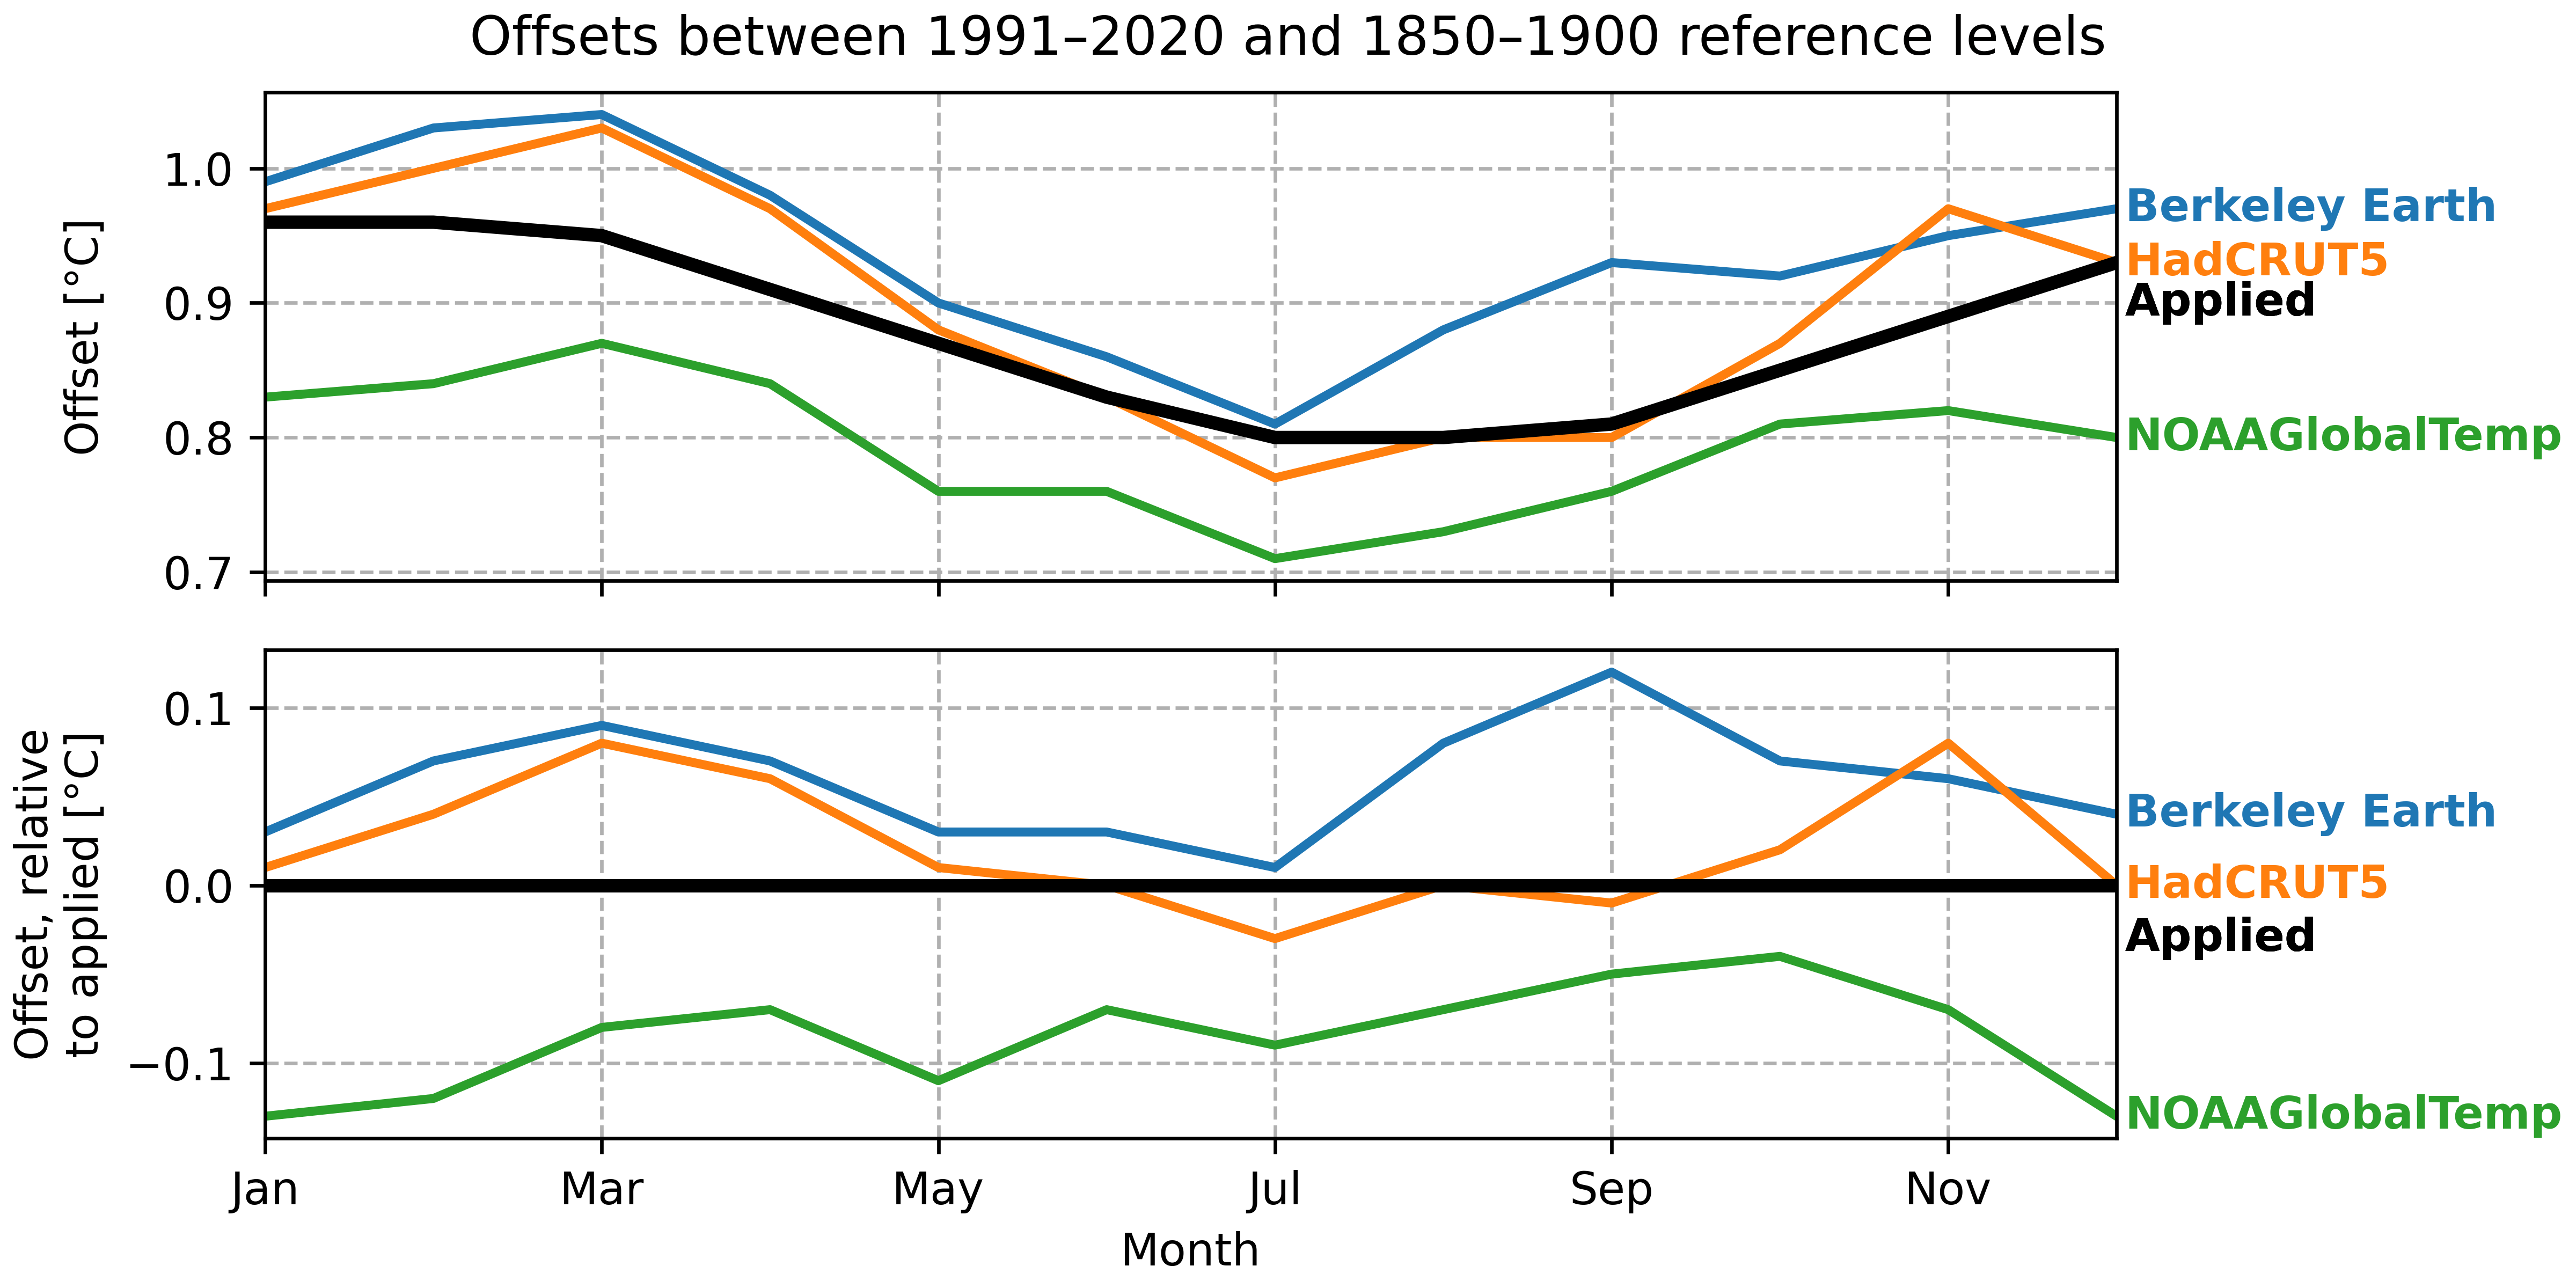
Fig. 8.2.2 Offsets applied to adjust temperature anomalies from a 1991–2020 baseline to an 1850–1900 (pre-industrial) baseline.#
The uncertainty on the global average temperature anomaly offset resulting from this variability can be roughly estimated as the standard deviation of the three annual means, 0.06 °C. This propagates into an uncertainty of 2–4 years on the estimated date of reaching 1.5 °C, depending on the slope and date range. Since the slope of the fitted line is not affected, there is no additional uncertainty on comparisons between 30-year fitting ranges. For early starting dates, an uncertainty of 2–4 years is small compared to the year-on-year variations and to the total duration. It is significant for recent years – for example, in January 2025, the estimated time left until 1.5 °C was <5 years.
Users intending to modify the application for a specific region should be aware that the global average offset might not be directly applicable, especially in regions with particularly strong (e.g. the Arctic [Rantanen+22]) or weak (e.g. the North Atlantic [Sgubin+17]) warming. In these cases, it can be worthwhile to derive region-specific offsets from the source datasets.
3. Trend estimation#
GTTM uses a least squares linear fit (implemented through numpy.polyfit) to estimate and extrapolate a 30-year trend.
While past and projected temperature curves are typically more complicated than a straight line [O’Neill+16], a simple linear fit can adequately describe trends since the 1970s [Mudelsee+19], especially for illustrative rather than predictive purposes.
The 30-year range corresponds to the standard length of time used by the World Meteorological Organization (WMO) for climatology [WMO].
As an example, for the period of January 1995 – January 2025, the best-fitting parameters are a slope \(m\) = 0.00214 °C/month (0.0257 °C/year) and an offset \(c\) = 0.604 °C, meaning the 1.5 °C threshold would be reached \((1.5\,\text{°C} \, – \, c)/m\) = 418.6 months from January 1995, or November–December 2029. The GTTM interface rounds this result down, in this example to November 2029.
The numpy.polyfit routine can provide an uncertainty estimate in its outputs, representing the fit uncertainty due to the spread in the data but not the uncertainty in the data themselves. The corresponding estimated uncertainties are \(\sigma_m\) = 8.2 × 10⁻⁵ °C/month (3.8%) and \(\sigma_c\) = 0.017 °C (2.8%), with a correlation coefficient of \(r_{m,c}\) = –0.87 (i.e. strongly negatively correlated). The corresponding uncertainty \(\sigma_t\) in the month of reaching 1.5 °C \(t\) can be estimated using a Taylor expansion, the correlated equivalent of the sum-of-squares method:
Where \(\mathbf{\Sigma}\) is the covariance matrix and \(\mathbf{J}\) is the Jacobian matrix \(\mathbf{J} = \left[\begin{matrix}\frac{\partial t}{\partial m}&\frac{\partial t}{\partial c}\\\end{matrix}\right]\).
The resulting uncertainty is 10 months, or February 2029 – October 2030 in this example.
The choice of a least squares fit for the regression line, rather than an alternative, does not significantly affect the result. For example, a Theil–Sen (median-of-slopes) estimator, implemented using scikit-learn, provides an estimated slope \(m\) = 0.00208 °C/month and offset \(c\) = 0.594 °C for the same data. The equivalent date of reaching 1.5 °C would be April 2031. The scikit-learn method does not provide an uncertainty estimate on these parameters, and a manual calculation is outside the scope of this assessment. However, comparing the difference between the two linear estimators (16 months) to the uncertainty in one (10 months), the unknown uncertainty in the other, the uncertainty resulting from the anomaly calculation (see above), as well as the uncertainty in ERA5 data in general, it can be concluded that the difference is not significant and that the least squares fit is suitable.
4. Visualisation of uncertainty#
While GTTM does not explicitly provide uncertainty estimates on the underpinning data, its fitted trend line, or the estimated date of reaching 1.5 °C, it does provide users with some tools to intuit these uncertainties. First, sliding between different 30-year ranges and seeing the change in estimated date indicates the level of uncertainty due to natural variability (e.g. particularly hot or cold months) and actual changes in the rate of global warming. Second, there is an overlay showing the typical uncertainty in IPCC projections of climate projections.
The documentation extensively explains that the purpose of GTTM is to illustrate climate change to a broad audience, not to predict it. Comparing the uncertainty in different aspects of the application (anomaly calculation, trend estimation) to the uncertainty in the underpinning dataset and the physical variability in global temperature (natural and man-made), we can conclude that GTTM is fit for this purpose.
ℹ️ If you want to know more#
Key resources#
More about the ERA5 reanalysis:
More about temperature anomalies:
More about climate trend estimation:
More about the 1.5 °C and 2 °C targets:
Code libraries used:
References#
[Cavalleri+24] F. Cavalleri et al., ‘Inter-comparison and validation of high-resolution surface air temperature reanalysis fields over Italy’, International Journal of Climatology, vol. 44, no. 8, pp. 2681–2700, 2024, doi: 10.1002/joc.8475.
[Cointe+23] B. Cointe and H. Guillemot, ‘A history of the 1.5°C target’, WIREs Climate Change, vol. 14, no. 3, p. e824, 2023, doi: 10.1002/wcc.824.
[Copernicus Climate Change Service+24] Copernicus Climate Change Service (C3S), ‘European State of the Climate 2023’, Copernicus Climate Change Service (C3S), Apr. 2024. doi: 10.24381/bs9v-8c66.
[Copernicus Climate Change Service+25a] Copernicus Climate Change Service (C3S), ‘ERA5: uncertainty estimation’, Copernicus Knowledge Base. Accessed: May 21, 2025. [Online]. Available: https://confluence.ecmwf.int/display/CKB/ERA5%3A+uncertainty+estimation
[Copernicus Climate Change Service+25b] Copernicus Climate Change Service (C3S), ‘Climate Bulletin – About the data and analysis’, Copernicus Climate Change Service (C3S). Accessed: May 13, 2025. [Online]. Available: https://climate.copernicus.eu/climate-bulletin-about-data-and-analysis
[ECVs for climate variability dataset] H. Hersbach et al., ‘Essential climate variables for assessment of climate variability from 1979 to present’. Copernicus Climate Change Service (C3S) Climate Data Store (CDS), Apr. 18, 2019. doi: 10.24381/7470b643.
[ERA5 monthly dataset] H. Hersbach et al., ‘ERA5 monthly averaged data on single levels from 1940 to present’. Copernicus Climate Change Service (C3S) Climate Data Store (CDS), Apr. 18, 2019. doi: 10.24381/cds.f17050d7.
[Frijters+25] S. Frijters, ‘366 warme dagen: het temperatuurrecord van 2024 in cijfers’, De Volkskrant, Jan. 10, 2025. Accessed: May 09, 2025. [Online]. Available: https://www.volkskrant.nl/wetenschap/~b301f81f2/
[Hersbach+20] H. Hersbach et al., ‘The ERA5 global reanalysis’, Quarterly Journal of the Royal Meteorological Society, vol. 146, no. 730, pp. 1999–2049, May 2020, doi: 10.1002/qj.3803.
[Horton+24] H. Horton, L. Swan, A. L. González Paz, and H. Symons, ‘The climate crisis in charts: how 2024 has set unwanted new records’, The Guardian, Nov. 20, 2024. Accessed: May 09, 2025. [Online]. Available: https://www.theguardian.com/environment/2024/nov/20/the-climate-crisis-in-charts-how-2024-has-set-unwanted-new-records
[IPCC+23] IPCC, ‘Climate Change 2023: Synthesis Report. Contribution of Working Groups I, II and III to the Sixth Assessment Report of the Intergovernmental Panel on Climate Change’, Intergovernmental Panel on Climate Change (IPCC), Geneva, Switzerland, Jul. 2023. doi: 10.59327/IPCC/AR6-9789291691647.
[Liu+24] R. Liu et al., ‘Global-scale ERA5 product precipitation and temperature evaluation’, Ecological Indicators, vol. 166, p. 112481, Sep. 2024, doi: 10.1016/j.ecolind.2024.112481.
[Marlon+21] J. R. Marlon et al., ‘Hot dry days increase perceived experience with global warming’, Global Environmental Change, vol. 68, p. 102247, May 2021, doi: 10.1016/j.gloenvcha.2021.102247.
[Mitchell+16] D. Mitchell, R. James, P. M. Forster, R. A. Betts, H. Shiogama, and M. Allen, ‘Realizing the impacts of a 1.5 °C warmer world’, Nature Climate Change, vol. 6, no. 8, pp. 735–737, Aug. 2016, doi: 10.1038/nclimate3055.
[Mudelsee+19] M. Mudelsee, ‘Trend analysis of climate time series: A review of methods’, Earth-Science Reviews, vol. 190, pp. 310–322, Mar. 2019, doi: 10.1016/j.earscirev.2018.12.005.
[O’Neill+16] B. C. O’Neill et al., ‘The Scenario Model Intercomparison Project (ScenarioMIP) for CMIP6’, Geoscientific Model Development, vol. 9, pp. 3461–3482, Sep. 2016, doi: 10.5194/gmd-9-3461-2016.
[Poynting+25] M. Poynting, E. Rivault, and B. Dale, ‘World’s hottest year: 2024 first to pass 1.5C warming limit’, BBC News, Jan. 10, 2025. Accessed: May 09, 2025. [Online]. Available: https://www.bbc.com/news/articles/cd7575x8yq5o
[Rantanen+22] M. Rantanen et al., ‘The Arctic has warmed nearly four times faster than the globe since 1979’, Communications Earth & Environment, vol. 3, p. 168, Aug. 2022, doi: 10.1038/s43247-022-00498-3.
[Scherrer+24] S. C. Scherrer, C. de Valk, M. Begert, S. Gubler, S. Kotlarski, and M. Croci-Maspoli, ‘Estimating trends and the current climate mean in a changing climate’, Climate Services, vol. 33, p. 100428, Jan. 2024, doi: 10.1016/j.cliser.2023.100428.
[Sgubin+17] G. Sgubin, D. Swingedouw, S. Drijfhout, Y. Mary, and A. Bennabi, ‘Abrupt cooling over the North Atlantic in modern climate models’, Nature Communications, vol. 8, p. 14375, Feb. 2017, doi: 10.1038/ncomms14375.
[Shen+22] B. Shen, S. Song, L. Zhang, Z. Wang, C. Ren, and Y. Li, ‘Temperature trends in some major countries from the 1980s to 2019’, Journal of Geographical Sciences, vol. 32, no. 1, pp. 79–100, Jan. 2022, doi: 10.1007/s11442-022-1937-1.
[United Nations+15] United Nations, ‘Paris Agreement’, United Nations, Paris, France, Dec. 2015. Accessed: May 12, 2025. [Online]. Available: https://treaties.un.org/doc/Treaties/2016/02/20160215 06-03 PM/Ch_XXVII-7-d.pdf
[Yilmaz+23] M. Yilmaz, ‘Accuracy assessment of temperature trends from ERA5 and ERA5-Land’, Science of The Total Environment, vol. 856, p. 159182, Jan. 2023, doi: 10.1016/j.scitotenv.2022.159182.
[WMO] World Meteorological Organization, ‘WMO Climatological Normals’, World Meteorological Organization. Accessed: Jun. 20, 2025. [Online]. Available: https://community.wmo.int/en/activity-areas/climate-services/climate-products-and-initiatives/wmo-climatological-normals