

3.1. Monitoring and reproducing Arctic weather extremes with a global and a regional reanalysis dataset#
Production date: 09-03-2026
Produced by: Fabio Mangini, Nansen Environmental and Remote Sensing Center (NERSC)
🌍 Use case: Reproducing and monitoring polar lows in the Arctic#
❓ Quality assessment question#
What are the benefits of a regional over a global reanalysis product for studying polar lows?
Polar lows are intense mesoscale low-pressure systems that usually form during cold air outbreaks in the high latitudes (e.g., Stoll et al., 2021). They have attracted and continue to attract considerable attention due to their relevance for the climate system and their impact on society (e.g., Moreno-Ibáñez et al., 2021). From a climate perspective, for example, polar lows contribute to the heat exchange between the ocean and the atmosphere by inducing intense sensible and latent heat fluxes. From a societal perspective, they can generate intense winds which, in turn, can severely disrupt human activities and pose a threat to lives at sea and in coastal areas.
Atmospheric reanalyses are invaluable tools for studying polar lows. At first, they do not only rely on observations, but also incorporate model-based forecasts (Parker, 2016). Observations alone are often insufficient, due to their limited number in the Arctic combined with the small sizes of polar lows, which range between 200 and 1000 km (Moreno-Ibáñez, 2024). Additionally, atmospheric reanalyses offer the advantage of being provided on regular grids, at consistent temporal intervals, and over extended time periods.
ERA5, the fifth generation of the ECMWF global atmospheric reanalysis (Hersbach et al., 2020), has been widely used to study polar lows (Moreno-Ibáñez, 2024). For example, Stoll (2022) used ERA5 to report on the global climatology of polar lows, Meyer et al. (2021) to study their 3-dimensional structure, and Boyd and Wang (2022) to determine the large-scale atmospheric conditions where polar lows develop.
Despite its importance, though, ERA5 has its own limitations. Notably, it has a spatial resolution of 0.25°x0.25°, which is insufficient to capture the fine horizontal spatial-scale features of polar lows. Additionally, it has been noted to underestimate the extreme values of near-surface wind speed associated with polar lows (e.g., Gurvich et al., 2022).
A regional reanalysis, such as the Copernicus Arctic Regional Reanalysis (CARRA), can help partly overcome these limitations. Run with lateral boundary conditions provided by ERA5, CARRA can potentially better characterize the physical properties of polar lows because, although restricted to the European sector of the Arctic, it has a spatial resolution of approximately 2.5 km, which is finer than that of ERA5, and assimilates a larger number of observations.
Despite its potential, though, the ability of CARRA to capture and describe polar lows needs to be assessed. The present work reports on the capabilities of CARRA and ERA5 on pressure levels to detect polar lows over the European Arctic. The assessment is done through a literature review and, as such, no computation is performed. Instead, the results presented are based on (1) the master thesis by Zhaohui Cheng (Cheng, 2023) and (2) CARRA’s Full System Documentation.
📢 Quality assessment statement#
These are the key outcomes of this assessment
When compared to radiosonde data, CARRA reproduces temperature and wind speed better than ERA5 in terms of bias and standard deviation, especially for pressure levels higher than approximately 200 hPa.
A case study analysis suggests that both CARRA and ERA5 can potentially detect polar lows and represent their main features, with CARRA providing a more detailed depiction of their structure.
📋 Methodology#
The present assessment explores and compares the properties of polar lows in the European sector of the Arctic based on CARRA, a regional atmospheric reanalysis for the European Arctic, and ERA5, a global atmospheric reanalysis. At first, the assessment presents an evaluation of both CARRA and ERA5 on pressure levels against radiosonde data. This comparison is based on CARRA’s Full System Documentation. Then, the assessment summarizes one of the results in Cheng (2023) by comparing the ability of ERA5 and CARRA to reproduce a polar low that occurred in the Norwegian Sea in April 2007, which is used as a case study.
The assessment is organised as follows:
ERA5
CARRA
Evaluation of ERA5 and CARRA on pressure levels
Properties of polar lows: ERA5 vs CARRA
Satellite image
Relative vorticity: ERA5 vs CARRA
📈 Analysis and results#
Description of the datasets#
ERA5#
The current assessment is based on the temperature, the zonal and the meridional components of the velocity field from ERA5 on pressure levels (Hersbach et al., 2020). The dataset is global, provided on 37 pressure levels spanning from 1000 to 1hPa, and available since the first of January 1940. The dataset has a horizontal spatial resolution of 0.25°x0.25°, a variable vertical spatial resolution ranging from 1 to 50hPa, and a temporal resolution of 1 hour.
CARRA#
The current assessment is also based on the temperature, the zonal and the meridional components of the velocity field from CARRA on pressure levels. CARRA on pressure levels has a temporal resolution of 3 hours, a horizontal spatial resolution of 2.5 km, and a variable vertical spatial resolution, with the vertical spacing between pressure levels ranging from 10 to 100hPa. We would like to note that, while CARRA has 65 model levels, CARRA on pressure level is provided on 23 pressure levels, spanning from 1000 to 10hPa.
Data are available since the first of September 1990, and cover two domains over the European sector of the Arctic. The western domain (CARRA-West) includes Greenland, the Labrador Sea, Davis Strait, Baffin Bay, Denmark Strait, Iceland, Jan Mayen, the Greenland Sea, and Svalbard; the eastern domain (CARRA-East) includes Svalbard, Jan Mayen, Franz Josef Land, Novaya Zemlya, the Barents Sea, and the northern parts of the Norwegian Sea and Scandinavia.
We should note that the results presented below, in the section “Properties of polar lows: ERA5 vs CARRA”, are based on Cheng (2023), who interpolates the CARRA dataset on a grid with a 0.1°x0.1° horizontal resolution or, in other words, a resolution coarser than the original CARRA dataset. As stated by Cheng (2023), this choice was made to reduce the time needed by his polar low detecting algorithm to run, but to still be able to detect the mesoscale low-pressure systems in the European Arctic and reproduce their small-scale features.
Evaluation of ERA5 and CARRA on pressure levels#
This section presents a quality assessment of ERA5 and CARRA on pressure levels through a comparison with radiosonde data. The assessment, which is based on Section 3 of CARRA’s Full System Documentation, addresses temperature and wind speed between approximately 950 and 50 hPa for September 1997, January 2000, and April 2007.
Overall, Figures 3.1.1 and 3.1.2 (both a readaptation of Figure 3.2 in the Full System Documentation of CARRA) indicate that the observed temperature and wind speed agree better with the estimates from CARRA than from ERA5. CARRA outperforms ERA5 in terms of both bias and standard deviation, with improvements of up to circa 50 percentage points. The improvememts appear to depend on the pressure level, being it less pronounced or absent for pressure levels below approximately 200hPa, while showing little dependence on year and season, although additional analysis is likely needed to confirm this conclusion due the limited number of years considered.
The results for the standard deviation differentiate between temperature and wind speed, with CARRA offering a greater improvement over ERA5 in terms of wind speed rather than temperature. When the bias is considered, the comparison with the observed temperature and wind speed indicates that both CARRA and ERA5 are negatively biased at most pressure levels. However, unlike the standard deviation, this comparison does not clearly distinguish between temperature and wind speed.
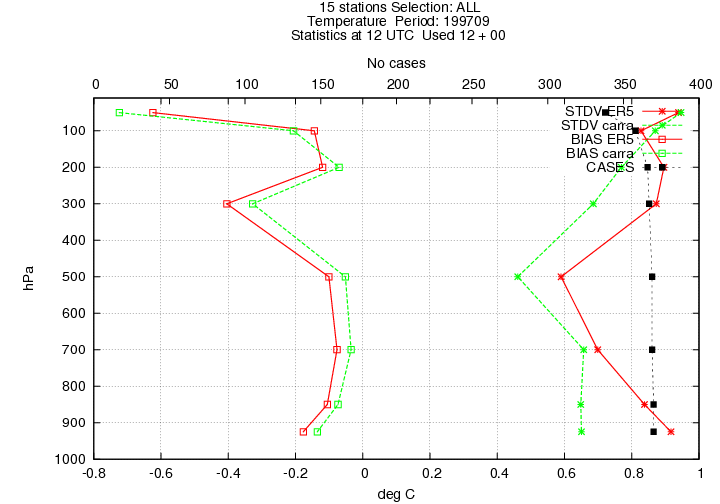
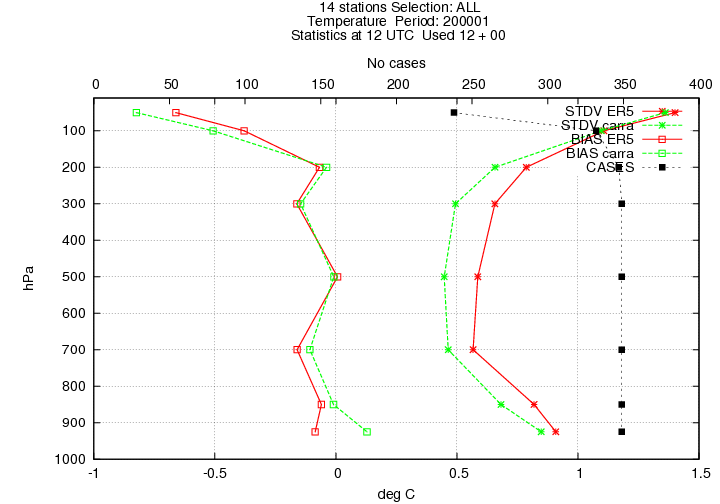
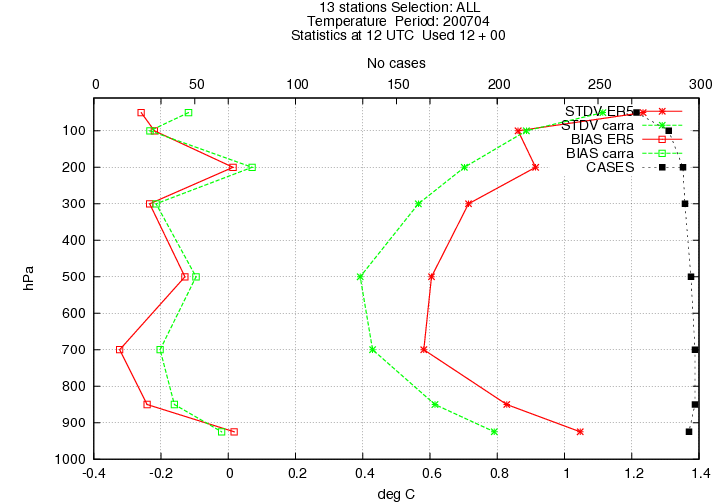
Fig. 3.1.1 Vertical profiles of averaged standard deviation (STDV) and bias errors of CARRA reanalysis (green) and ERA5 (red) computed against radiosonde measurements over CARRA’s domains for temperature for the months of September 1997 (upper plot), January 2000 (middle plot), and April 2007 (lower plot). Results are shown on key pressure levels. The figure is a readaptation of Figure 3.2 in the Full System Documentation of CARRA.#
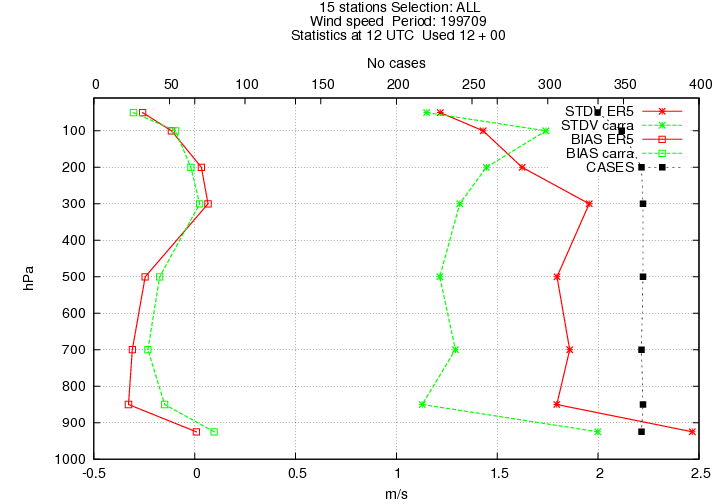
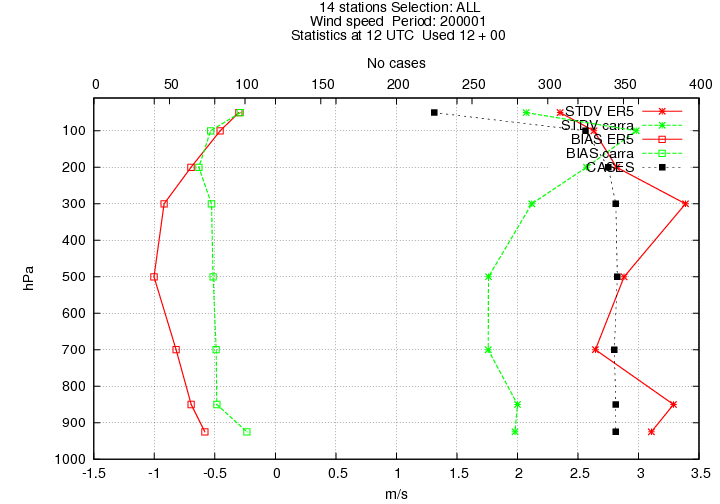
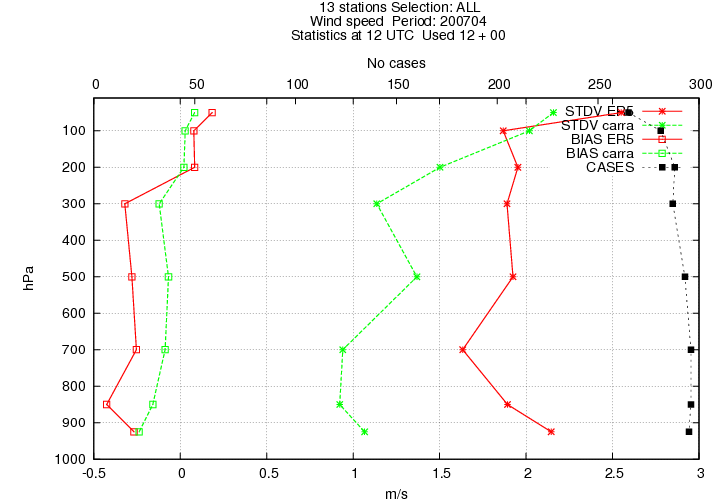
Fig. 3.1.2 Same as Figure 3.1.1, but for wind speed.#
Properties of polar lows: ERA5 vs CARRA#
The ability of ERA5 and CARRA to capture polar lows is assessed through a case study. Following Cheng (2023), we select a polar low that developed over the Nordic Seas on the 6th of April 2007. This polar low appears in Noer and Lien (2010), who present a list of subjectively selected polar lows over the Nordic Seas between 2000 and 2010.
Satellite image#
Figure 3.1.3 shows an image of the polar low provided by NOAA-15 AVHRR on the 6th of April 2007 at 06:31 - 07:18 UTC. The image depicts a polar low over the Nordic Seas, approximately between Svalbard and mainland Norway. The polar low appears in its mature stage, with its distinctive comma shape and a mostly cloud-free eye, and it is characterized by wave-like ripples at the edge of the cirrus shield.
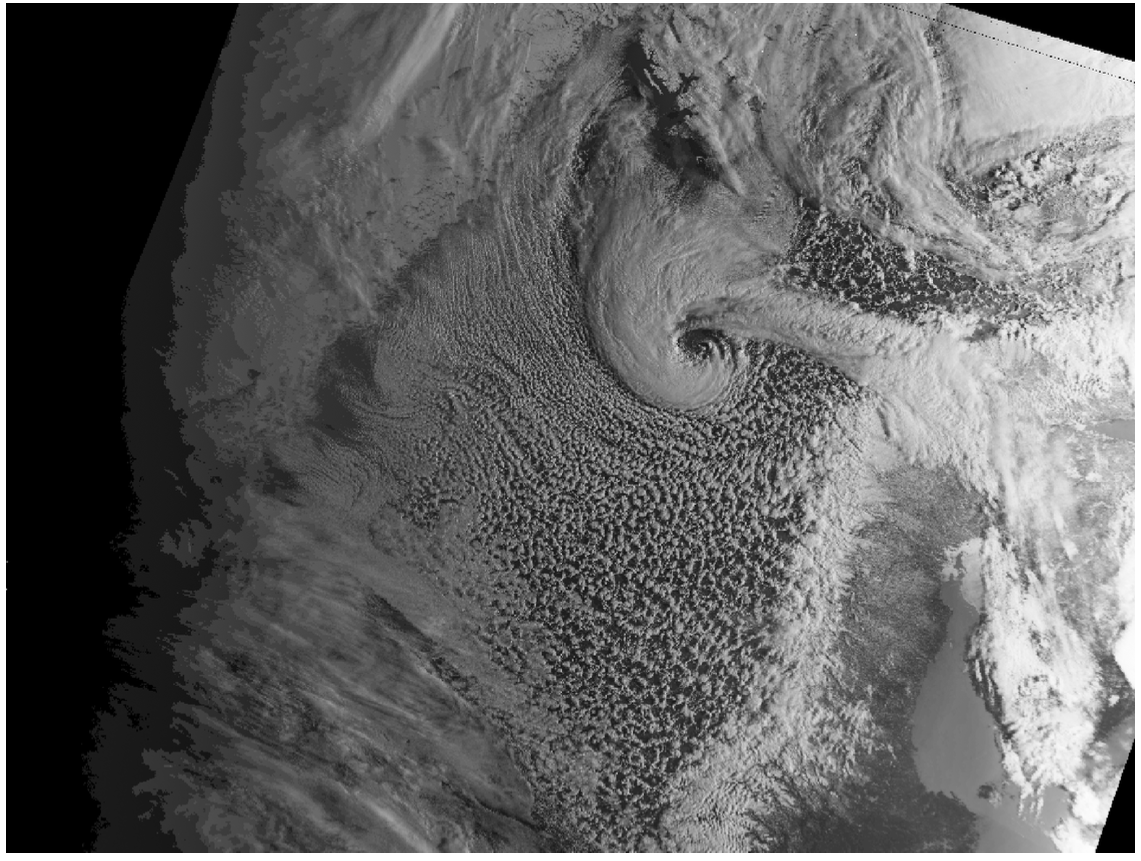
Fig. 3.1.3 Figure 10 in Cheng (2023), showing a polar low image taken by NOAA-15 AVHRR at 06:31 - 07:18 UTC on the 6th of April 2007. The Norwegian coast is visible on the right side of the image, while Svalbard in the upper part.#
Relative vorticity: ERA5 vs CARRA#
Following Cheng (2023), we consider the relative vorticity at 950hPa at 06:00 UTC on the 6th of April 2007, and we compare the ability of ERA5 and CARRA to reproduce the horizontal features of the polar low under study.
Figure 3.1.4 indicates that ERA5 and CARRA are able to detect and return a comparable picture of the polar low. Both reanalysis datasets place the centre of the polar low, identifiable as a patch of high relative vorticity, at approximately the same location. Furthermore, they also agree on the location of the comma-shaped cloud system, which is also identifiable by a tail of relative vorticity maxima.
Despite these similarities, some differences exist between the polar low reproduced by ERA5 and by CARRA. At first, both reanalysis datasets place the centre of the polar low at approximately 72°N, but CARRA has it shifted circa 2° to the east with respect to ERA5. More notably, though, CARRA appears to reproduce the finer structures of the polar low when compared to ERA5. In particular, CARRA indicates that the tail of the polar low is thinner and has a relative vorticity which is higher than that provided by ERA5 and comparable to that of the polar low’s centre. These differences are expected to result from ERA5 having a lower spatial resolution than CARRA. CARRA also reveals stripes of high relative vorticity to the west and south of the eye. A comparison with the satellite image shown in Figure 3.1.3 indicates that these features exist and replicate the wave-like elements observed in the satellite data.
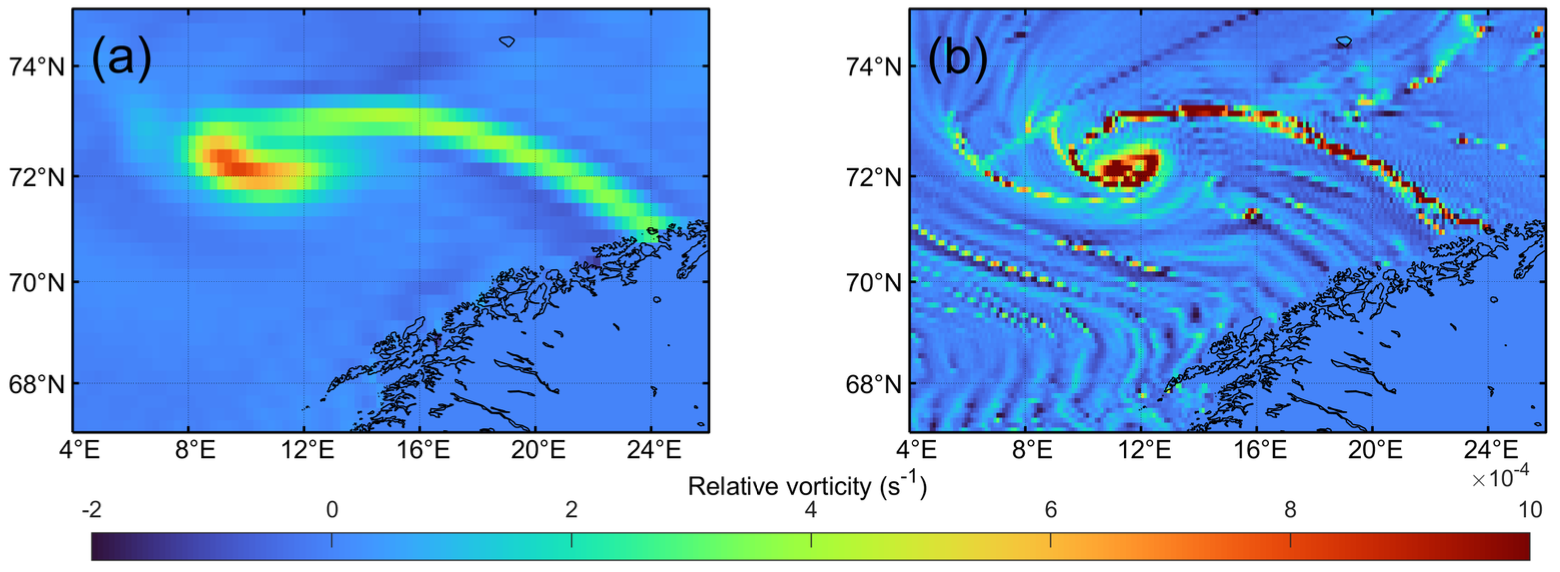
Fig. 3.1.4 Figure 12 in Cheng (2023) showing the relative vorticity at 950hPa obtained from ERA5 (a) and CARRA (b) at 06:00 UTC on the 6th of April 2007. The relative vorticity over land is set to zero.#
Conclusions#
This assessment presented a brief literature review to evaluate the consistency of the ERA5 and CARRA reanalysis datasets on pressure levels with observational data. It also compared the ability of these datasets to replicate the characteristics of polar lows in the European Arctic.
The evaluation against radiosonde data, based on text and figures from Section 3 of CARRA’s Full System Documentation, indicates that CARRA reproduces temperature and wind speed better than ERA5 in terms of bias and standard deviation, particularly for pressure levels higher than approximately 200 hPa. However, further analysis is likely needed, as the results presented in this assessment are based on a limited number of years.
A case study of a polar low presented by Cheng (2023) indicates that CARRA is preferable to ERA5 for reproducing the features of polar lows. A satellite image of the polar low was used as a reference for the comparison. The comparison showed that CARRA provided a finer representation of the center and tail of the polar low, and a better representation of the features around the polar low when compared to ERA5. Thus, as also indicated by CARRA’s Test and verification report, CARRA can potentially better reproduce high-impact weather events than ERA5 in the European sector of the Arctic.
Overall, the results reported by this assessment agree with the conclusions reached by previous works who assessed the ability of CARRA and ERA5 on single levels to reproduce polar lows. For example, Khachatrian and Asemann (2024) showed that CARRA provides a more detailed representation of the 10m wind field than ERA5 during a polar low event. Køltzow et al. (2022) further highlight CARRA’s overall ability over ERA5 to better reproduce the 2m temperature and the 10m wind speed associated with polar lows.
We would like to conclude by highlighting that the potential to study extreme events in the Arctic might be further enhanced by CARRA2, the second-generation Copernicus Arctic Regional Reanalysis. When compared to CARRA, CARRA2 shares its same spatial and temporal resolution, but extends its spatial and temporal coverage, by covering the entire Arctic north of 60°N since 1986. Furthermore, compared to CARRA, CARRA2 assimilates a larger number of observations and has been produced using updated schemes for snow, sea ice and glaciers. Some preliminary analysis highlights the advantage of CARRA2 over ERA5 to study extreme events in the Arctic, as shown at https://climate.copernicus.eu/first-carra2-data-release-offers-new-insights-arctic-extremes A first release of CARRA2, which covers intermittent years, is already available at https://cds.climate.copernicus.eu/datasets?q=carra2, with the full dataset expected to be released by the end of 2026.
ℹ️ If you want to know more#
Key resources#
The interested reader can check the following resources:
The Advanced models and weather prediction in the Arctic (Alertness) project.
Presentation on polar lows by Dr. Justyna Wodziczko on the EUMeTrain website.
“Polar Lows: the coolest weather on the planet”, a blog about polar lows.
Polar low section of the “Manual of Synoptic Satellite Meteorology”.
News post about CARRA2, the second-generation Copernicus Arctic Regional Reanalysis
References#
Boyd, K., Wang, Z. 2024. Revisiting the Relationship between Polar Lows and Weather Regimes. J. Clim. 37 (5), 1523–1538. doi:10.1175/JCLI-D-23-0309.1.
Cheng, Z. 2023. Polar Mesoscale Cyclones in ERA5 and CARRA. 41 pp.
Gurvich, I., Pichugin, M., Baranyuk, A. 2023. Satellite Multi-Sensor Data Analysis of Unusually Strong Polar Lows over the Chukchi and Beaufort Seas in October 2017. Remote Sens. 15 (1), 120. doi:10.3390/rs15010120.
Hersbach, H., Bell, B., Berrisford, P., Hirahara, S., Horányi, A., et al. 2020. The ERA5 global reanalysis. Q. J. R. Meteorol. Soc. 146, 1990–2049. https://doi.org/10.1002/qj.3803
Khachatrian, E., Asemann, P. 2024. The Value of Sentinel-1 Ocean Wind Fields Component for the Study of Polar Lows. Remote Sens. 16 (20), 3755. https://doi.org/10.3390/rs16203755
Køltzow, M., Schyberg, H., Støylen, E., Yang, X. 2022. Value of the Copernicus Arctic Regional Reanalysis (CARRA) in representing near-surface temperature and wind speed in the north-east European Arctic. Polar Res. 41, 8002. doi:10.33265/polar.v41.8002.
Meyer, M., Polkova, I., Modali, K. R., Schaffer, L., Baehr, J., et al. 2021. Interactive 3-D visual analysis of ERA5 data: improving diagnostic indices for marine cold air outbreaks and polar lows. Weather Clim. Dynam., 2, 867–891. doi:10.5194/wcd-2-867-2021.
Moreno-Ibáñez, M., Laprise, R., Gachon, P. 2021. Recent advances in polar low research: current knowledge, challenges and future perspectives. Tellus A: 2021, 73, 1890412, https://doi.org/10.1080/16000870.2021.1890412
Moreno-Ibáñez, M. 2024. Polar low research: recent developments and promising courses of research. Front. Earth Sci. 12:1368179. doi:10.3389/feart.2024.1368179.
Noer, G., Lien T. 2010. Dates and Positions of Polar Lows over the Nordic Seas between 2000 and 2010. Met.no Report no 16/2010. The Norwegian Meteorological Institute: Oslo, Norway. 6 pp.
Parker, W. S. 2016. Reanalyses and Observations: What’s the Difference? Bull. Amer. Meteor. Soc., 97, 1565-1572. doi:10.1175/BAMS-D-14-00226.1.
Stoll, P. J., Spengler, T., Terpstra, A., Graversen, R. G. 2021. Polar lows – moist-baroclinic cyclones developing in four different vertical wind shear environments. Weather Clim. Dynam. 2, 19–36. doi:10.5194/wcd-2-19-2021.
Stoll, P. J. 2022. A global climatology of polar lows investigated for local differences and wind-shear environments. Weather Clim. Dynam., 3, 483–504. doi:10.5194/wcd-3-483-2022.